Reporting and Analytics (GOV)
The Data Warehouse uses Microsoft SQL Server Reporting Services (SSRS) for reporting purposes. SSRS is a server-based reporting platform that provides extensive reporting functionality, and which runs on Microsoft’s business intelligence platform.
Data Warehouse offers historical reporting abilities. A point-in-time (or snapshot) report shows current data or data for a specific date in the past. You can also specify from and to dates to view a slice of historical data. A log report shows when changes were last made to data within a specified period.
Concepts (GOV01.01)
- Auditors, managers, resource, and system owners want to get an overview of managed identities and access
- Answer the questions: who had access to what at any given time and who approved it
- Audit trail/decision log to track approvals and other decisions made for access
- Omada Identity has standard reports, supports custom reports
- Any user can access reports from Omada Identity Portal
- Data in reports filtered based on active user
- Reports can be exported
Standard reports (GOV01.01)
- Identity and access data reports
- Systems, Identities, Accounts, Resources, Resource assignment, Contexts
- Audit Trail
- Decision log for access
- Omada Risk Report
- Checks for risky access right
- Data Quality
- Accounts and groups without owner, duplicate assignments, unused accounts, empty groups
- Operations
Auditor reports (GOV01.01)
To go to the auditor reports, follow these steps:
-
Log in to the Omada Identity Portal as Judy Miller.
-
Go to Reports > Auditor reports > All identities.
-
Find the new identity. You can search for the identity if you expand the report parameters by clicking the small down arrow at the top of the report.
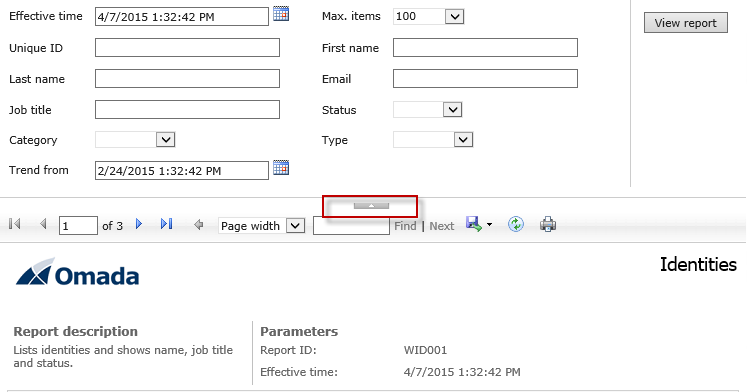
You can use free text parameters to search in the corresponding field in the database. The search supports wildcards. Use
_as a single character wildcard, and%as a multiple character wildcard -
Click View report to refresh the report list.
-
When you have found the identity, click the Unique ID to open the Identity details report.
-
If the import has not finished, the identity should be there, but not having any resource assignments. After import has finished, set the effective time parameter to now, or later, and refresh the report.
-
The identity is listed with all the assignments. Click the Resource assignment change log in the Related reports section of the report, to see when the access was assigned.
See decision log
-
Go to Reports > Auditor reports > Audit trail. This will show the audit trail report that shows all decisions made to resource assignments.
-
You will be able to see all decisions (approvals, attestations, evaluations) that were made. This report tracks all decisions in an audit trail, so that we can see who has approved a resource assignment, and why.
System owner reports (GOV01.01)
To go to the system owner reports, follow these steps:
-
Log in to the Omada Identity Portal as a system owner.
-
Go to Reports > My reports > My systems.
-
Click Active Directory. In the report, click the number of resource assignments. This opens the Resource assignment list for the system.
-
Expand the parameters for the report. In Identity, search for the identity for whom we approved a resource assignment in the survey. Click View report.
-
This limits the results. Click the account name to open the Account details report.
-
In the resource assignment list in the report, notice that color coding to the left of the resource assignments. Click the colored field for one of the resource assignments you provided an answer for in the survey. This opens the Resource assignment details report.
-
You can see both the assignment reasons, compliance status, and the answer you provided in the survey.
-
Go back to the Account details report. Click the point in the trend chart.
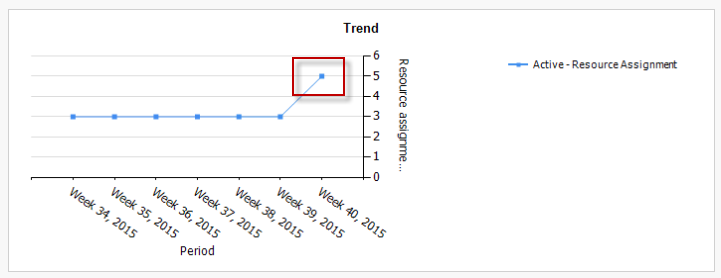
-
The Resource assignments change log is opened. This shows what changes happened in the given time period.
Key Performance Indicators
Resources without owners (GOV01.01)
Data Setup:
- Remove the Resource folder owner for one of the applications (the example below uses Anti-Fraud).
- Ensure that all Omada Identity Roles have an owner.
- Run a Master Data import with Analysis Services Enabled to process the data.
-
Log in as a system administrator.
-
Click the View all link in the Key Figures widget on the start page. The number should match the number of resources (minus the account resource) of the application you have removed the owner for. You can show the drill-down but point out that it would be good to also do something about the number.
-
Go to Setup > Master data > Policies > Control policies.
-
Open the All resources must have an owner policy.
-
Look how the policy is configured - it is based on a view.
noteThe counting methods between ES and ODW is different. You may therefore see some discrepancies if you select to run a control policy on the whole data set, for example, ES counts the account as a resource, but ODW does not.
-
Run the policy without changing any settings. Note that this normally runs on a schedule. It should create max 100 exceptions.
-
Log in as William Denver who is the owner of the Application.
-
You can edit one at a time or use the Mass edit. Add an owner and set the status to Solved.
-
Submit your answers.
-
To update the KPI you must run the master data import. Go to Setup > Administration > Connectivity > Import profiles.
-
Open the Import master data profile and click Start import. Click Ok in the confirmation dialog.
-
The import should run for a few minutes. You can explain the import process and/or show the import history screen. Once the import is done go to the start page and show that the number in the KPI has now gone down.
Orphan accounts (GOV01.01)
Data setup:
- Follow the steps in Account Ownership Review (GOV02.05) to prepare one or more orphan accounts in the Active Directory system.
- Import data to ODW with the Enable Analysis Services customer setting set to True.
-
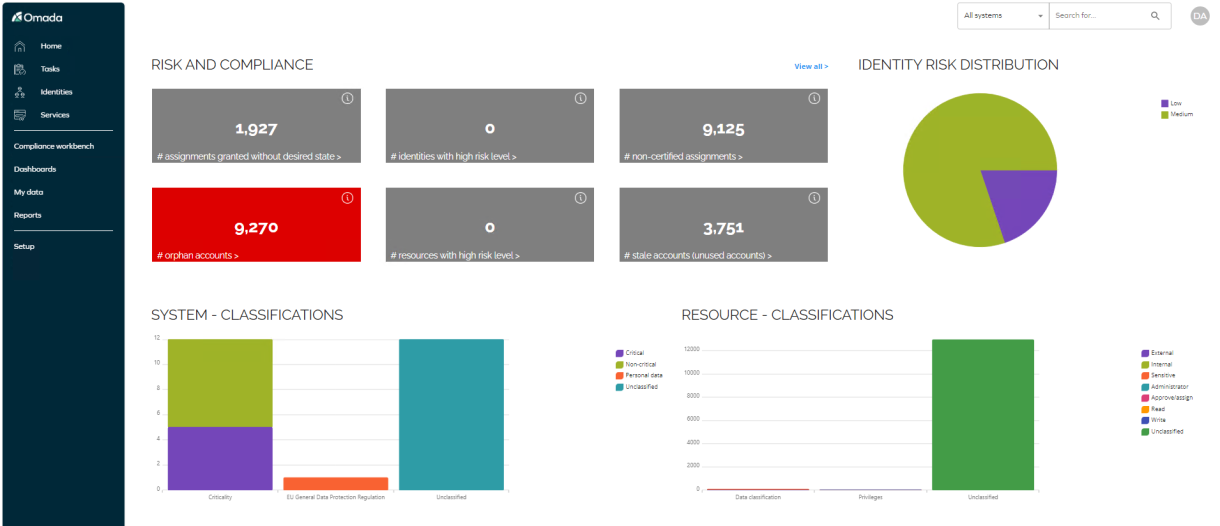
Log in as a data administrator or system owner. Click the link in the Key Figures widget on the start page.
-
Find the orphan accounts KPI. Note that there are a few accounts shown. Click the name to open the drill-down. There you can see which account that have been found.
-
You can solve this in two ways
- Run an account ownership survey. This can be done from the Compliance workbench or the system onboarding page.
- Create a new account rule for the accounts shown in the system onboarding page for the relevant system and run an import. Remember to set reinitialize ownership and classification before you run an import.
All SoD Violations + Identities pending violation evaluation (GOV01.01)
The SoD constraint violations shows the number of CRAs that have a violation. It includes both those violations that are not reviewed yet, and those that are overwritten.
The Identities pending violation evaluation is the number of identities that have a pending violation.
In a standard SalesDemo there are 11 violations and 3 identities counted.
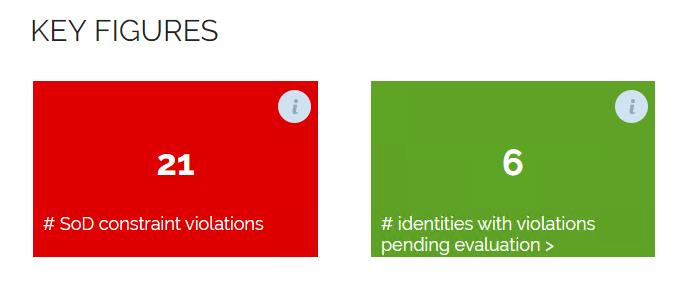
To demo the KPI, first show the KPIs and then close one of the open Evaluate violation tasks that are open. Remember that there is an approval step. Wait for RoPE to finish calculation of the affected identities, then look at the KPI again. The # of identities have gone down, but the total number of violations stay the same. For additional details see the Constraint Violations view in My data > Auditor reports > Constraint Violations.
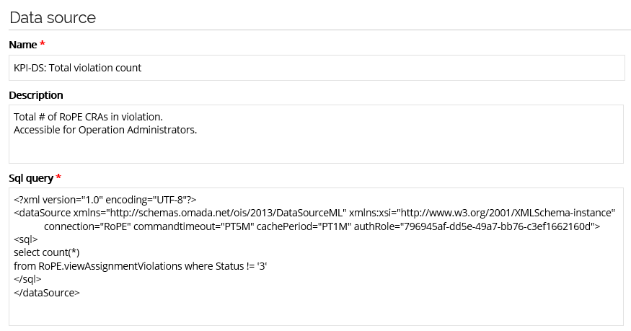
Configuration options:
- If you do not want to include Overridden violations, set the Data Source definition used for the KPI to not count status 3.
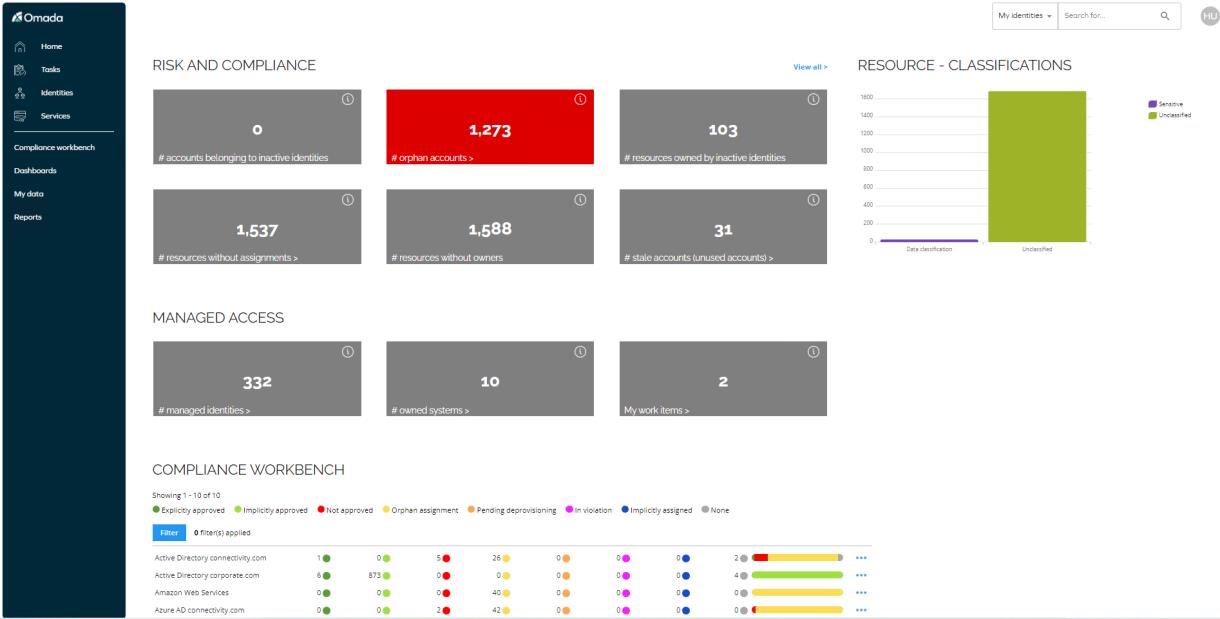
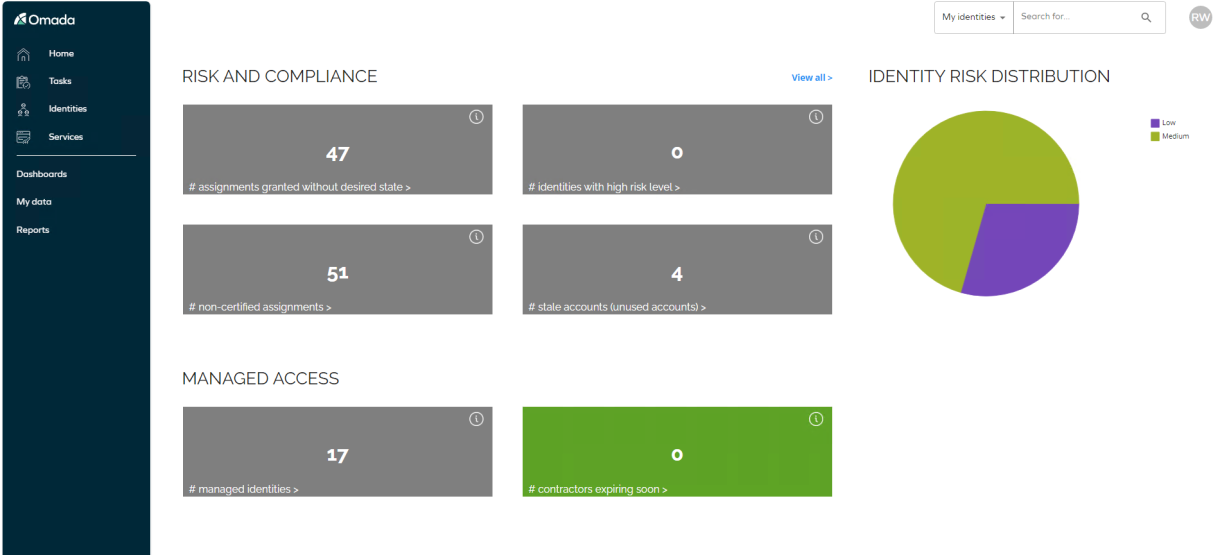
Persona-based dashboards
Three new persona-based dashboards have been introduced. They are accessible via the menu:
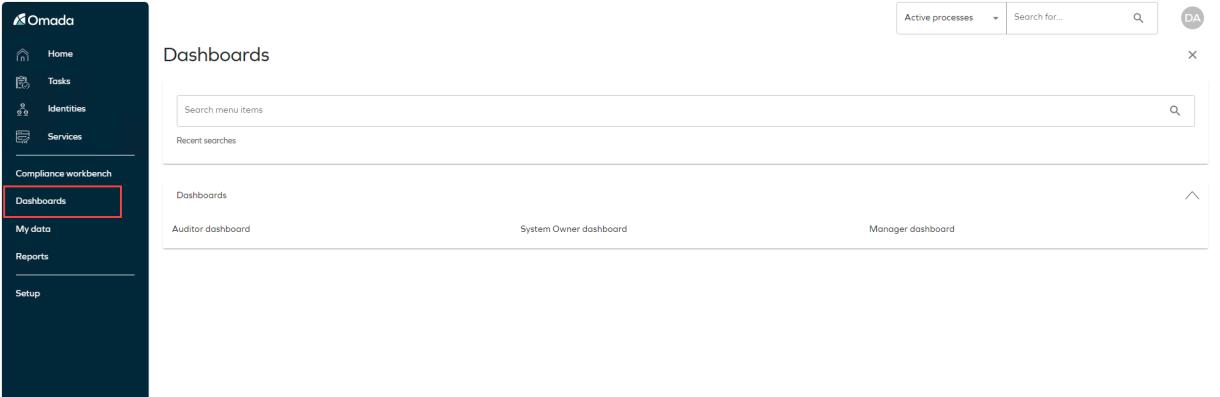
The menu items are only available if the active user is a member of the relevant user groups. Otherwise, the menu items will not be shown.
Auditor Dashboard:
System Owner Dashboard:
Manager Dashboard:
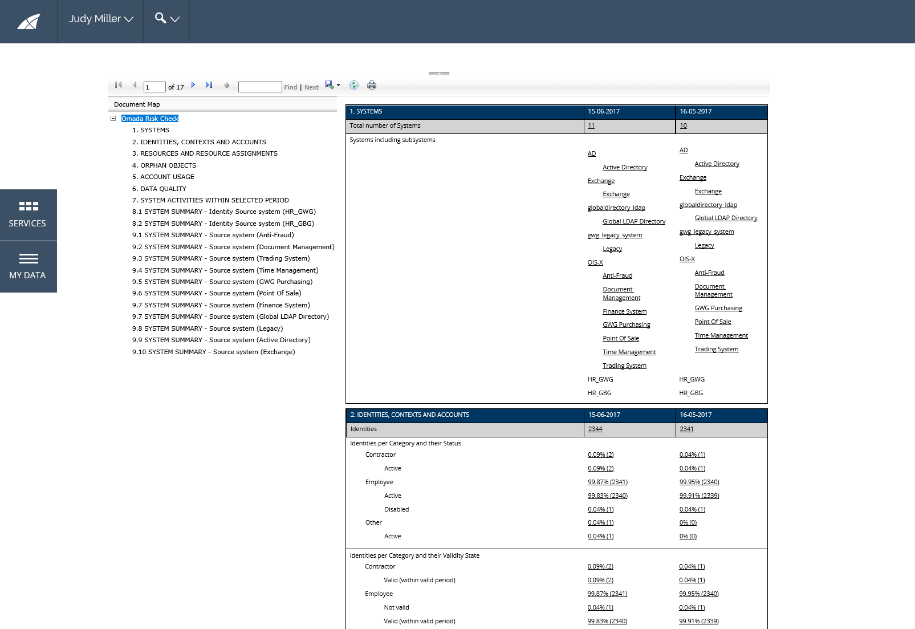
Omada Risk Check (GOV01.01)
The reports takes several minutes to load, so if you want to present it for an audience, it is a requirement that you launch the report before the presentation. You can also save the report as a PDF.
The Audit report is an overview for auditors to monitor how a company’s assets are protected. It shows information to see security risks, render them compliant over time, and to monitor improvements. It provides access to Omada’s standard reports.
Content (GOV01.01)
The Omada Risk check report contains seven sections, plus a summary section for each system.
The different sections of the Omada Risk Check report contain sections which include these typical objects:
- System - a unique IT system such as a (specific) corporate Active Directory, for example, an instance of Active Directory of the company.
- Identity - an identity represents a uniquely definable object, for example, a person, or a piece of equipment, for example a computer or mobile phone.
- Context - a context which an identity is in. A context represents the relationship an identity has with the organization, for example, department, project, cost center, or building.
- Account - a specific user account in a specific system, for example, an Active directory user.
- Resource - a representation of an asset. It is often a role or permission, for example, an Active Directory group, IT role, file share, SharePoint document, physical key, or other objects that can be assigned to one or more identities.
- Resource assignments - a resource assignment represents the relationship between an identity and a resource, for example, person has an account (user) in Active Directory (AD). If the user is a member of an AD group, the person who is the owner of the AD user has a resource assignment to the group, via the account.
- Orphan objects - the ownership has not been determined, for example, identities, contexts, accounts, resource, or resource categories can be orphaned.
Top view of the report in the demo environment
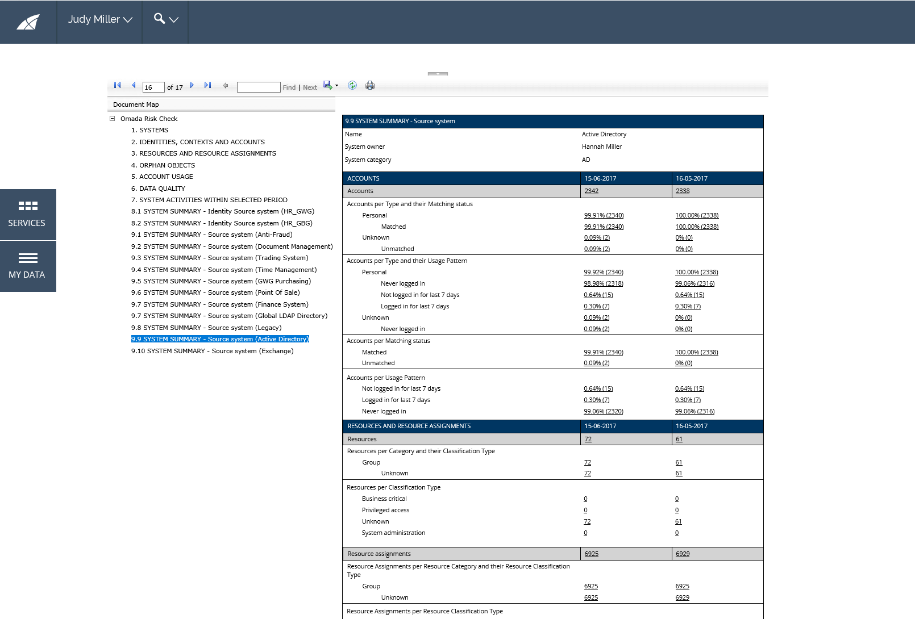
Overview for Active Directory
Role Analytics tool
The role mining tool is designed to present Omada Data Warehouse data using Microsoft Power BI technology. This allows for effective browsing/analysis of large amounts of data and complex relations.
The Power BI report offers most of the data present in ODW and further enrich with statistical and analytical numbers. For the more advanced user the pivot model is open and can be adjusted as needed.
The numbers in the model are dynamic in nature and reacts to the actual scope present when applying filters and clicking in slicers.
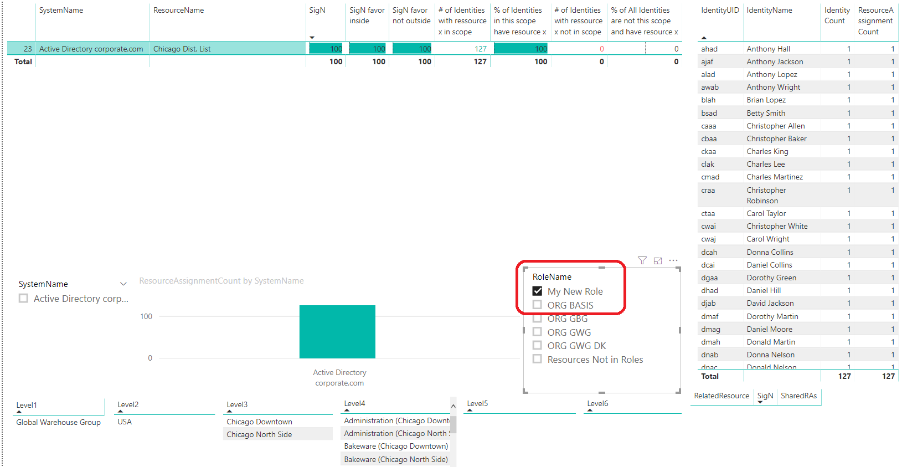
Numbers can be number of relational objects in each scope like number of Identities, Accounts, resources, assignments and systems or it can be calculated numbers like significance and identities with/without resource in/outside scope.
The more advanced user can fill in data on the role sheet and see the modeled roles candidates in the pivot and filter out already covered assignments when building new roles.
-
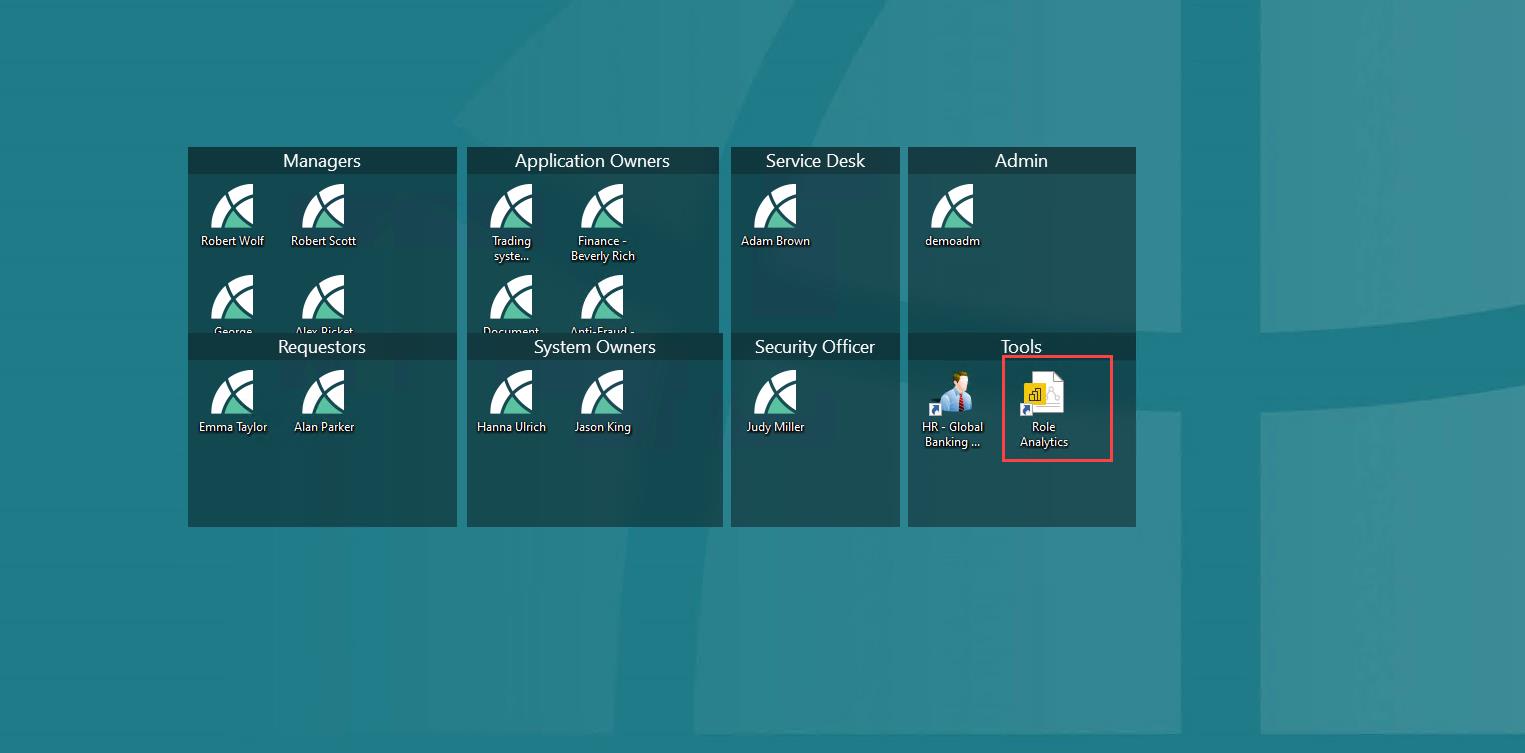
Launch Role Analytics from the icon on the desktop.
-
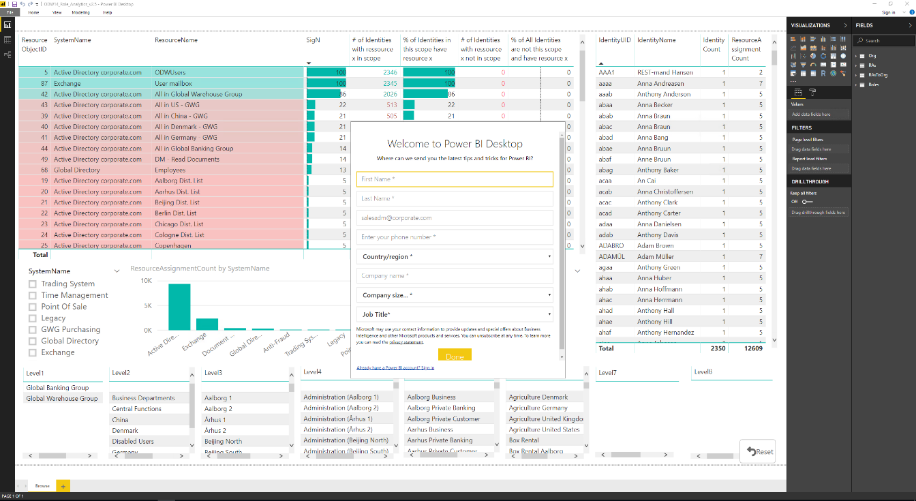
This opens Power BI Desktop.
-
First time you log in, you are asked to either create a free account or sign in with an existing Power BI account.
-
Data is now being read from ODW into Power BI and after a short while the model will be populated.
-
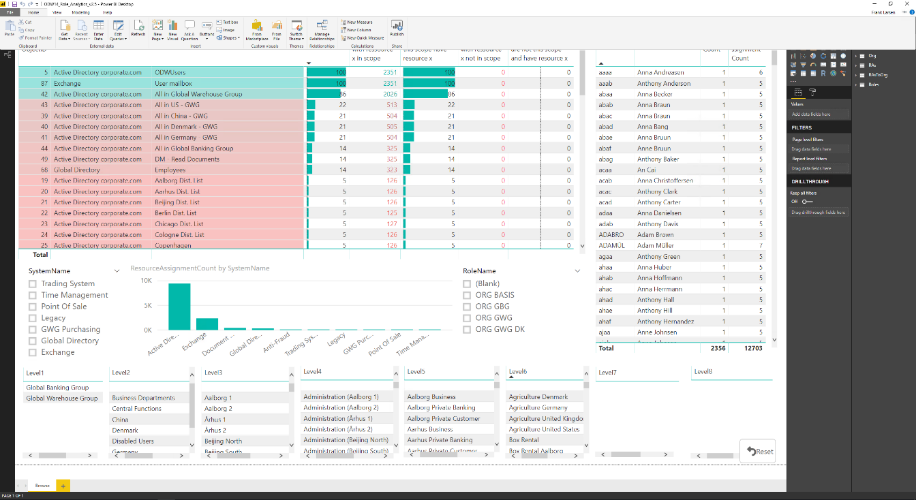
Now you can start working with the data, below is an introduction of the most relevant columns.
-
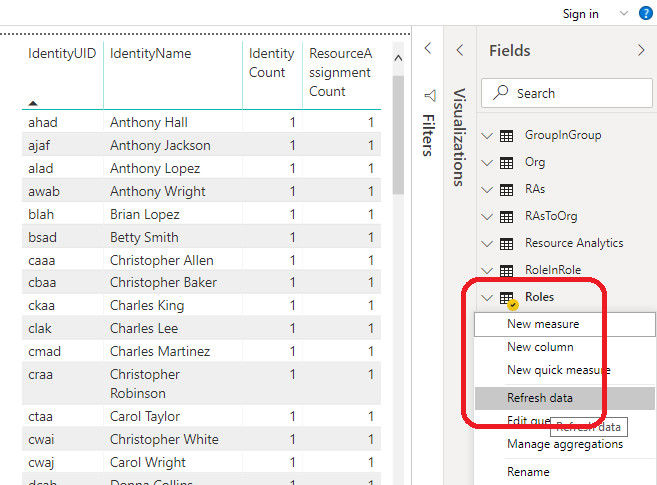
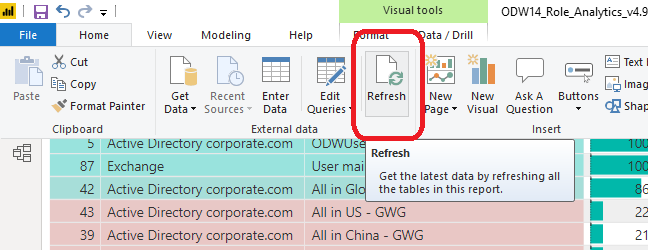
If desired at a later stage, you can refresh the data by clicking Refresh.
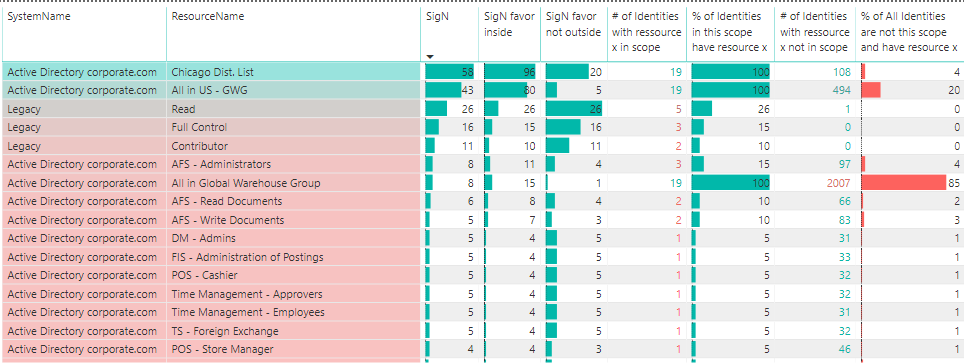
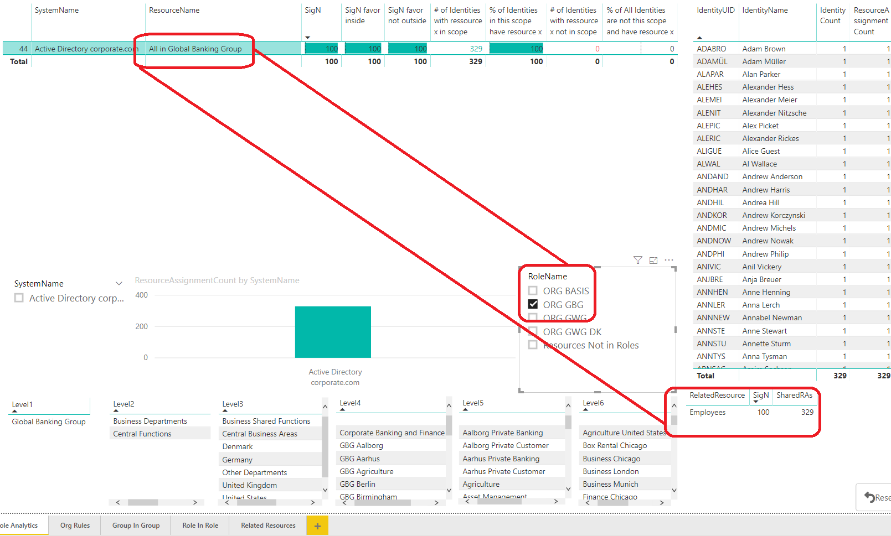
SigN is a number between 0-100 expressing the significance per resource in a given scope. If you have no filters applied, then resources with a SigN number close to 100 will be candidates to enter a Basic role. Click on one department in the slicers and you get resource candidates for an Organizational role.
By selecting a number of individuals (Identities) sharing a common job function (or project or other) and you get resource candidates to enter a job role.
The scoring system for SigN is calculated as a balance (average) between SigN favor inside and SigN favor not outside.
-
SigN favor not outside is very sensitive to assignments outside the analyzed reason (for example, a resource in a selected scope).
-
SigN favor inside is relatively slow in reacting to assignments outside the analyzed reason. Calculated as percent inside - percent outside.
-
“# of Identities with resource x in scope” lets you understand the magnitude of the selected scope per resource.
-
% of identities in scope have resource x is important since this express the ratio of Identities already assigned per resource in scope and therefore also the ratio of identities that will get new assignments to the resource, should you choose to assign a role containing resource x in the given scope.
-
“# of Identities with resource x not in scope” lets you understand how big a case it is to have resource x outside selected scope. Is it exotic to have resource x?
-
% of all identities are not in scope and have resource x - lets you understand why sometimes the SigN number can be low, even though every Identity in scope have the resource. Reason is that a high % of Identities outside the scope also holds the resource.
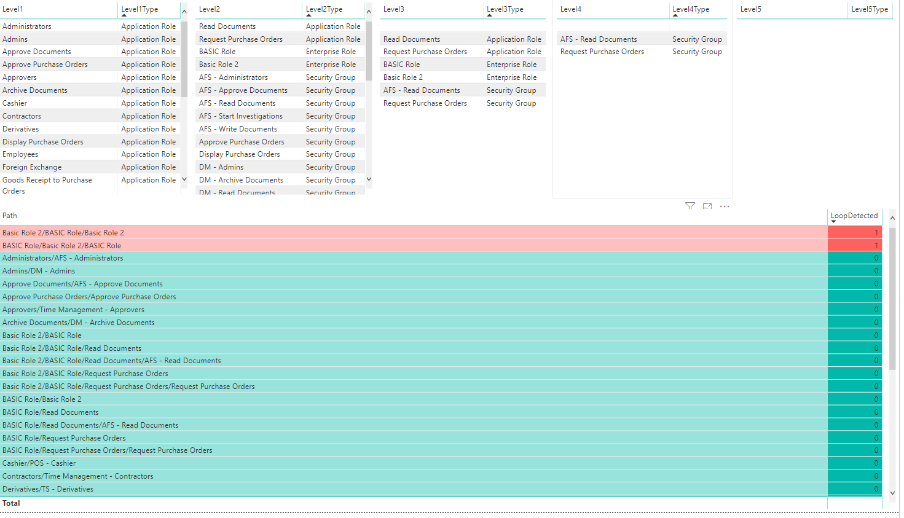
Role in Role analytics
The new role in role analytics will show parent child relations between roles in Omada Identity (including permissions) in a browsable format.
There is a built-in detection and display of possible loops.
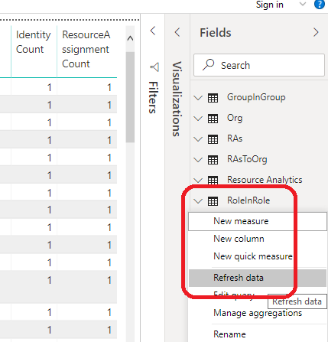
This table is marked for manual refresh, for example, right click the table and click Refresh.
The resource analytics table can take time to refresh on production data. This can be improved by deploying the stored procedure in the file c:\source\SP_Custom_RAsAnalytics.sql on the Omada Data Warehouse DB and then enable the call to it, in the Power BI analytics related resource table. Also consider adding access rights to the stored procedure Uncomment the call and remove or comment out the rest of the SQL se bellow picture:
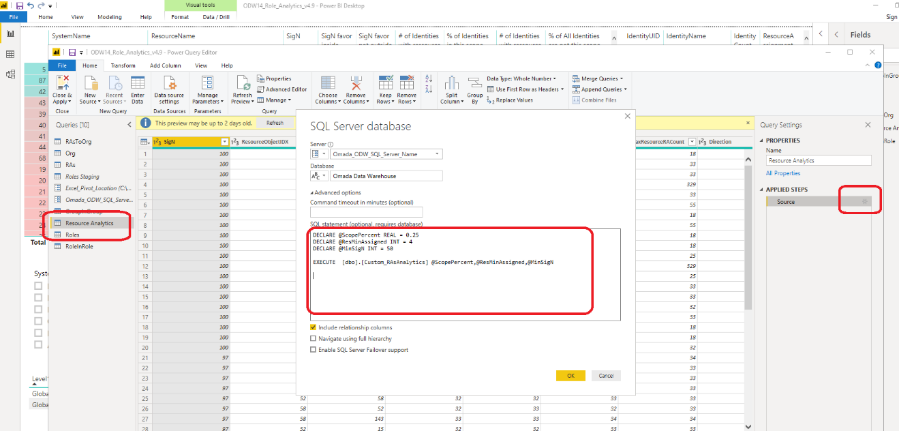
Related resources parameters:
DECLARE @ScopePercent REAL = 0.25@ScopePercentis a filter to only consider resources that are assigned to maximum, in this example, 25% of the organization.
DECLARE @ResMinAssigned INT = 4@ResMinAssignedis a filter to only consider resources that are assigned to minimum, in this example, 4 identities.
DECLARE @MinSigN INT = 50-
@MinSigNis a filter to only include resource relations when the significance is greater than, in this example, 50. The significance score is calculated as number of shared assignments by two resources compared, divided by the most assigned *100.
-
Related resources analytics
Select newly created simulated role. See child content and where they are assigned (in total - not in common).
Now related resources will show if there are any significant other resources to consider based on current assignment patterns.
Graphical view of related resources:
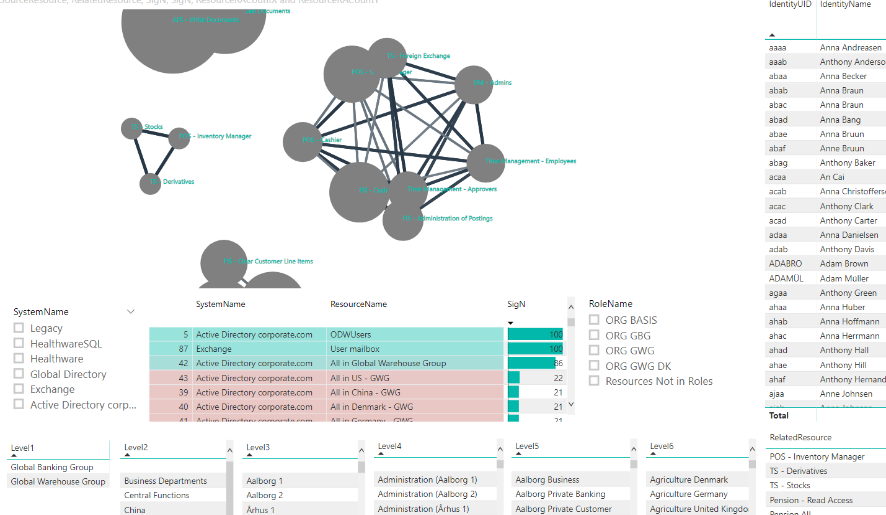
-
Size of bullet = number of assignments
-
Thickness of lines = significance of relation
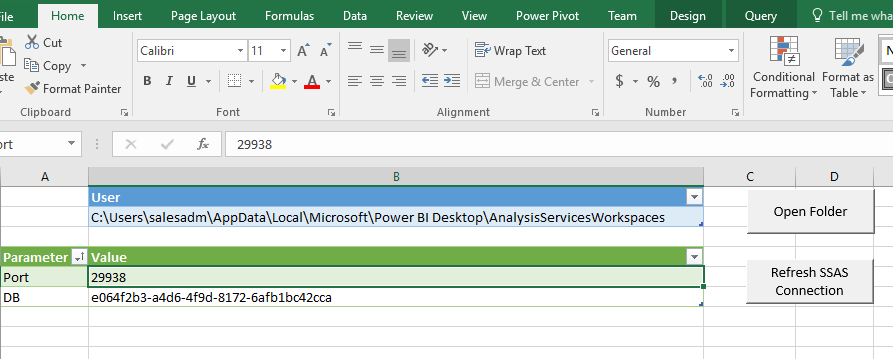
Browse and analyze Power BI in-memory model in Excel
When Power BI Desktop is running with role analytics loaded (only one copy), it is possible to connect to the Power BI in-memory model (SSAS) from the ODW14_Role_Analytics_v4.9_TEMPLATE.xlsm Excel file.
Click the Refresh SSAS Connection in the Connection sheet.
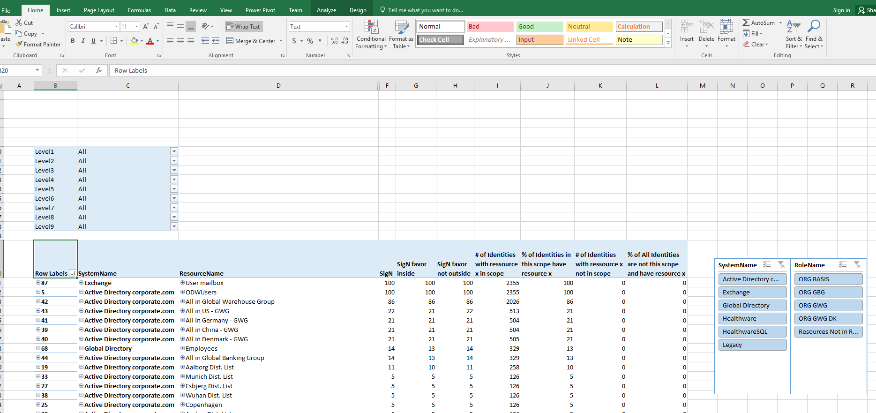
It is now possible to use the pivot table in the Pivot sheet:
Role simulation
New role candidates can be designed and entered in the Roles sheet by copying ResourceObjectID, SystemName, and ResourceName from the Pivot sheet and entering a Role name:
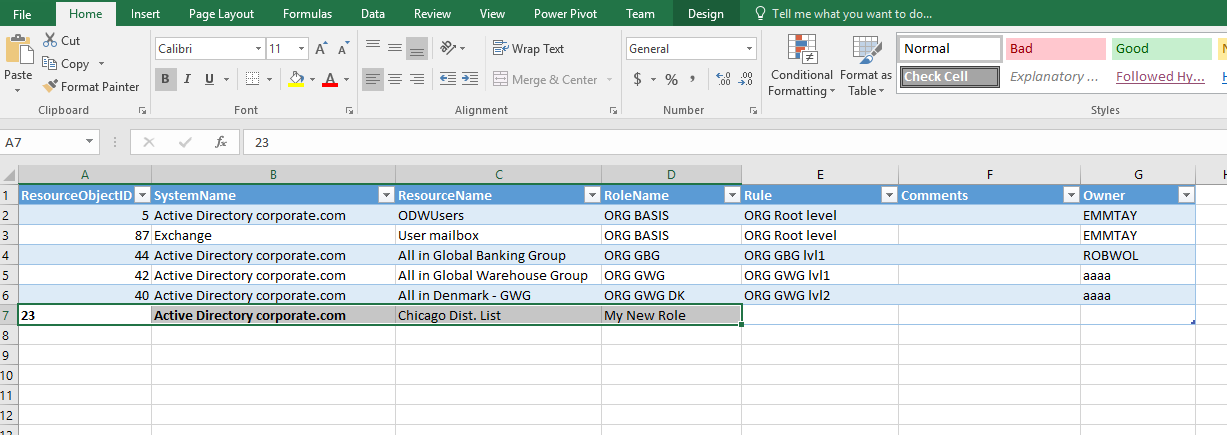
Saving the Excel and refreshing the Roles table in Power BI: