Certifications
The Certifications (previously: Open certifications) dashboard provides a focused view of active access review surveys and campaigns, helping managers and auditors track progress and completion.
Overview
This dashboard provides a single-view summary of certification survey data. It contains:
- Three summary charts showing survey question volume and decision outcomes.
- Two detail tables listing survey-level and reviewer-level data.
- Two trend charts showing certification activity over time.
- A Filters panel that lets you narrow the data shown across all widgets.
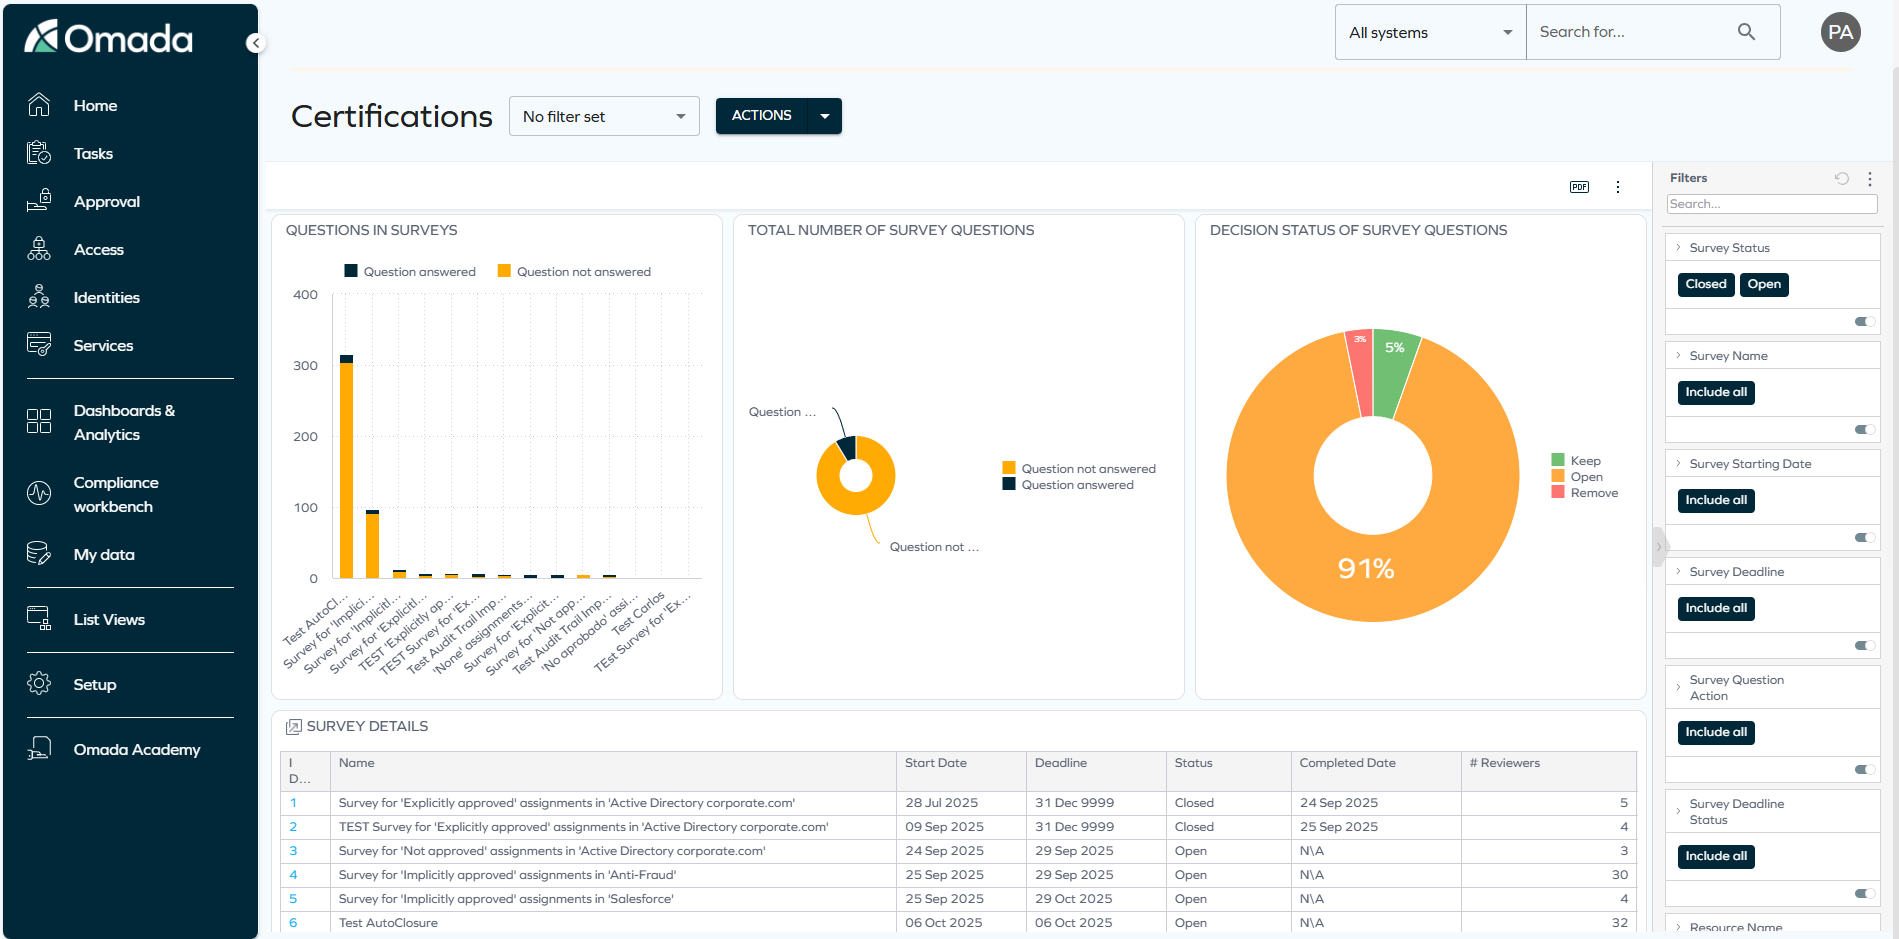
Read below to understand how data is structured, what each widget displays, and how you can use filtering to investigate certification activity in more detail.
Understanding the data
Before analyzing the data shown on the dashboard, read the following important notes about the data model and filtering behavior.
The data displayed on the Certifications dashboard reflects the state of the last successful build, which occurs every day after midnight; it is not streamed live. For more information, see the introduction to dashboards: Omada Identity Analytics – Data model.
Understanding and using widgets
The widgets on this dashboard are designed to provide a high-level overview of survey activity, while also allowing you to drill down into the underlying data.
For a full understanding of surveys, see the Surveys documentation.
The following sections explain the purpose of each widget and how to use them effectively.
- Charts
- Questions in surveys
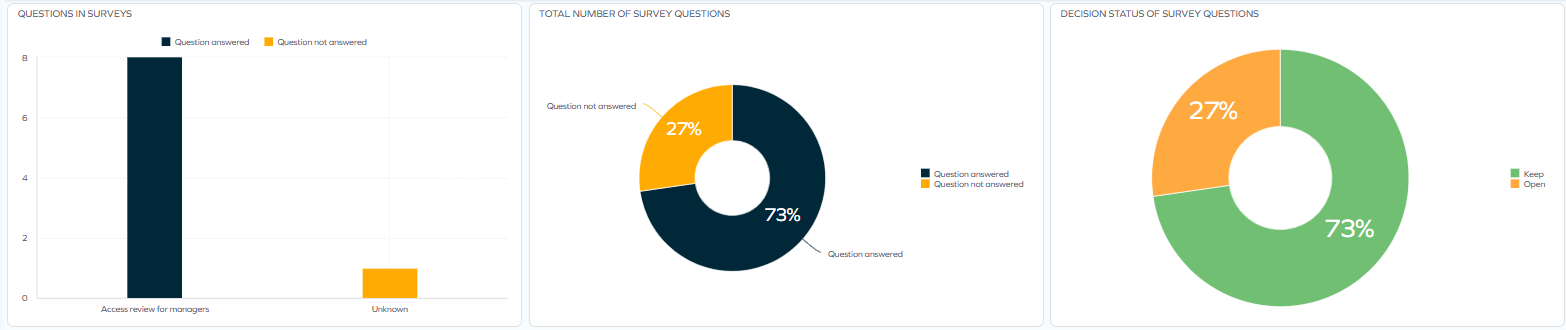
This widget displays the number of questions within a specific survey, showing the survey name and whether each question has been answered or remains unanswered. It allows you to quickly assess completion status and identify any pending responses that require attention.
- Total number of survey questions
This widget visualizes the distribution of answered versus unanswered survey questions in a clear pie chart format. It provides an at-a-glance view of overall completion status, helping you quickly understand progress and identify areas that need attention.
- Decision status of survey questions
This widget presents a pie chart summarizing the decision status of survey questions, categorized as Keep, Remove, or Open. It provides a quick visual breakdown of how many questions have been confirmed for retention, marked for removal, or remain undecided, enabling users to monitor certification outcomes at a glance.
- Completed questions per date
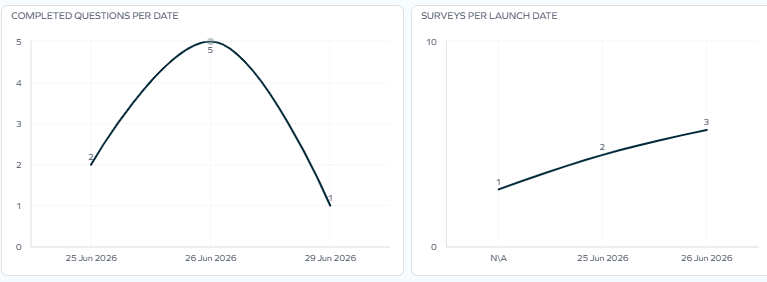
This widget displays a line chart showing the number of survey questions completed over time, based on their completion dates. It provides a clear visual trend of progress, helping you track activity patterns and monitor how quickly certifications are being finalized.
- Surveys per launch date
This widget presents a line chart showing the number of surveys launched over time, based on their launch dates. It provides a clear visual trend of survey initiation, helping you analyze activity patterns and track how frequently new certifications are being started.
- Tables
- Survey details

This table provides a detailed table view of each survey, including key information such as start and end dates, current status, completion date, number of reviewers, reassignments, completed versus total questions, and overall progress percentage. You can easily monitor survey timelines, track participation, and download the table for offline analysis or reporting.
- Reviewer details

This widget displays a detailed table of reviewer information, including their name, email address, number of surveys assigned, total questions, progress percentage, and percentage of decisions marked for removal. It helps administrators monitor reviewer workload, track completion rates, and identify trends in decision-making.
In both tables, the ID column is clickable, and it is highlighted in bright blue.
By clicking a number, you can jump to the survey details:
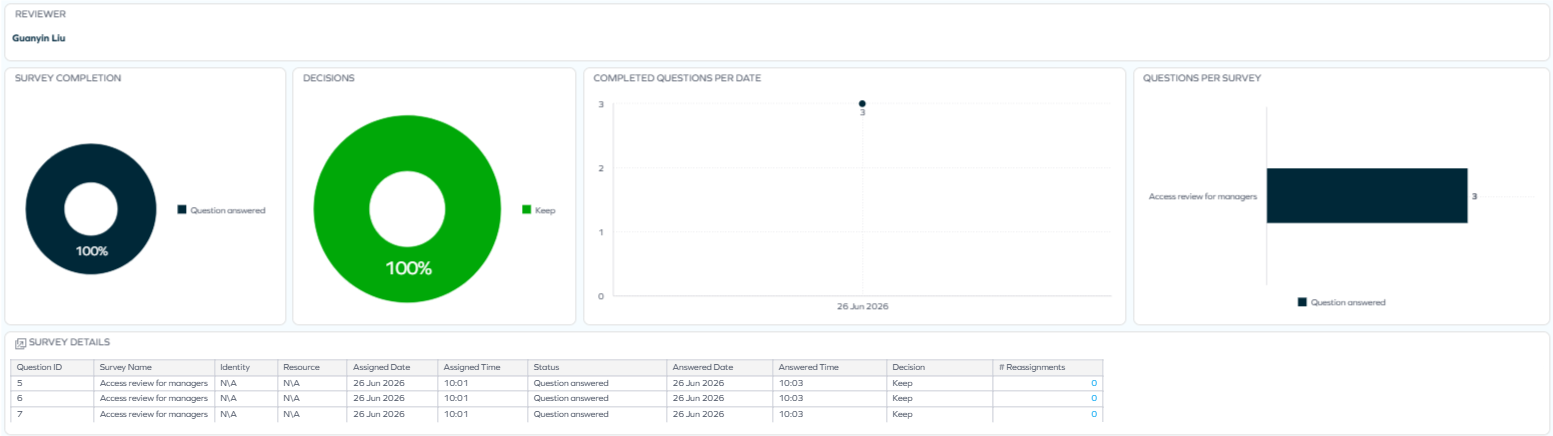
The survey details display comprehensive information about surveys, including:
- Who reviewed what – the identity, their account, and the resource.
- Which reviewer answered – the reviewer's name and ID.
- When the decision was made – assignment date and time, as well as when the response was submitted.
- Review status – whether the survey has been completed or is still open.
An example of a table rich in data is shown below:
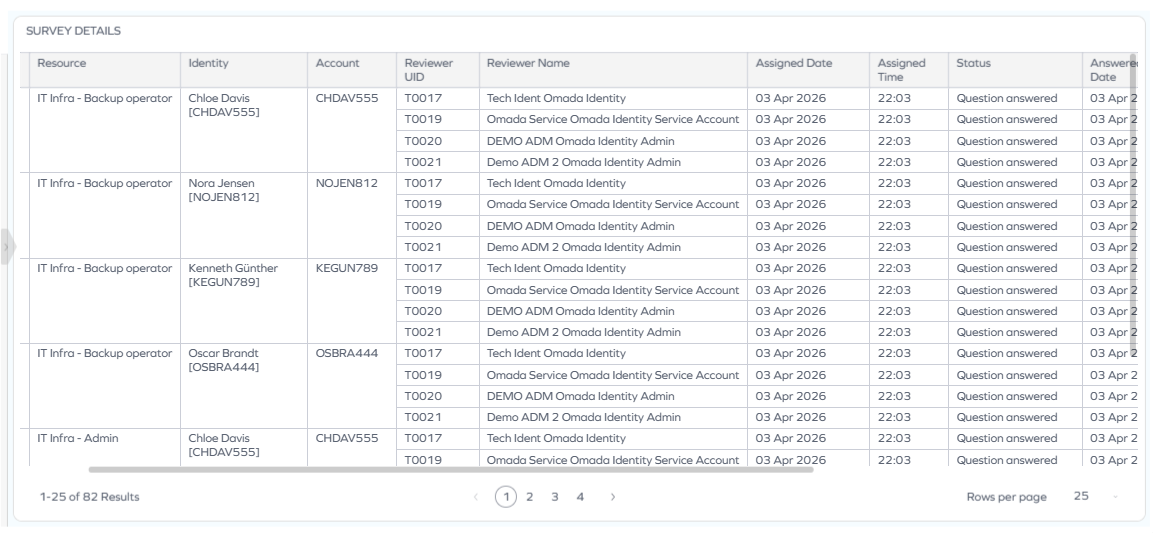
This level of details lets you quickly assess the progress and status of surveys.
Filtering
The information displayed across all widgets changes according to the filtering that you apply. For example, if you filter by a particular start date, the data on the other widgets reflects the same filtering (until you change or clear it).
You can enable and edit filtering:
-
By selecting any item on a chart.
-
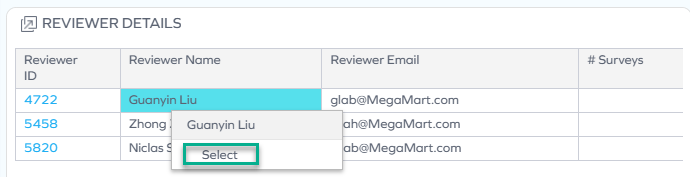
By right-clicking an item on a chart or in a table and clicking Select.
-
By selecting an item in the right pane, using any of the available filters:
Account Name,Answer Date Time,Date,Identity Approver Name, and more.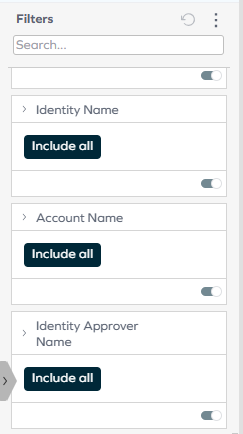
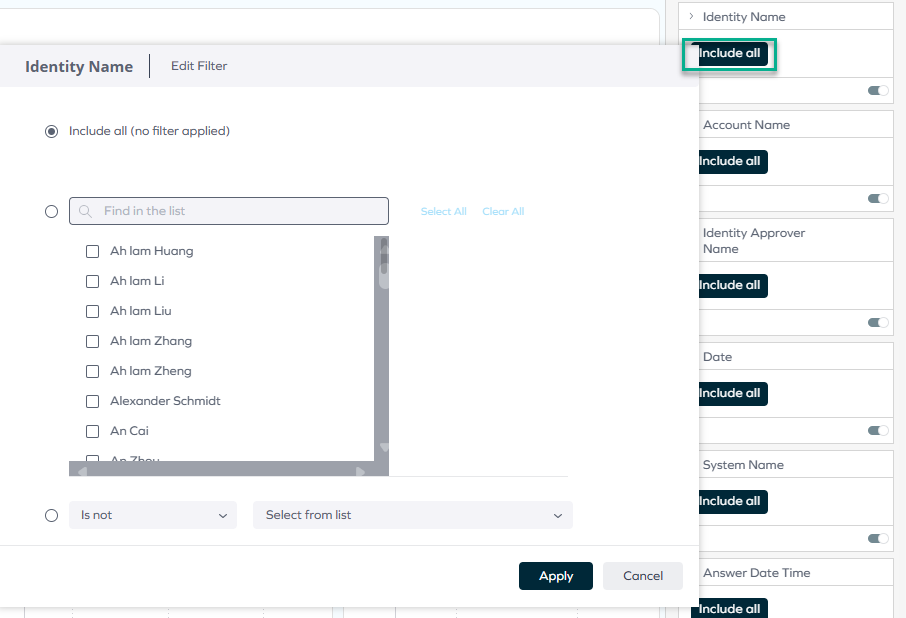
When you either click Include all or click the pencil icon (which appears when you hover over the top right corner of the rectangle), a pane opens, where you can select from a variety of options such as Is not, Contains, or Is not empty. Select the items of your choice and click Apply to filter the data across all widgets.
You can also disable filtering in a number of ways, for example:
-
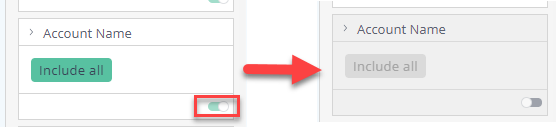
By disabling the toggle:
-
By selecting Clear selection, which appears in the top right corner of a widget when you hover over it:

-
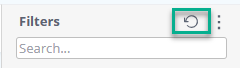
By resetting the filtering in the right pane:
Downloading and exporting
To export (download) the content of any widget, open the three-dots menu next to it, select Download, and choose a format.
Before you download the content of a widget, read Omada Identity Analytics – Downloading and exporting for details on the available formats as well as their limitations.
Example use case: comparing certification activity over time
The Certifications dashboard can be used to analyze whether certification campaigns are being launched and completed at a consistent pace, or whether there are gaps in governance activity.
Step 1: Reviewing survey launch frequency
- Look at the Surveys per Launch Date chart.
- Check whether surveys are being launched at a regular cadence or whether there are notable gaps between launch dates.
A sudden drop in launch frequency may indicate that certification campaigns have been paused or delayed, which could represent a gap in your access governance process.
Step 2: Reviewing completion activity
- Look at the Completed Questions per Date chart.
- Check whether question completion activity aligns with the launch dates visible in the previous chart.
Compare the two charts side by side. Ideally, a spike in launches should be followed by a corresponding rise in completions within a reasonable timeframe.
If completions remain flat after a batch of surveys was launched, this may indicate that reviewers are not engaging with their assigned surveys in a timely manner.
Step 3: Investigating specific surveys
- If you identify a period of low completion activity, apply a Date filter in the right pane to narrow the scope to that time period.
- Review the Survey Details table to identify which specific surveys were active during that period and check their % Progress and Status columns.
Step 4: Taking action
Based on your findings:
- If surveys were launched but not completed on time, identify the responsible reviewers in the Reviewer Details table and follow up.
- If no surveys were launched during a period where you would expect them, consider whether the relevant certification campaigns need to be restarted or rescheduled.
By combining the two trend charts with the Survey Details and Reviewer Details tables, you can move from a high-level view of certification cadence to a targeted investigation of specific campaigns and reviewers.