Data Quality
The purpose of the Data Quality dashboard is to allow the user to visualize and analyze potential data quality issues related to systems, accounts, identities, managers, resources, assignments, and contexts.
Overview
This dashboard contains widgets that display valuable data that can help spot potential issues: for instance, the percentage and total number of identities without a context or resources without assignments, the list of orphan resources or accounts, or the list of accounts pending deprovisioning.
It is divided into seven tabs:
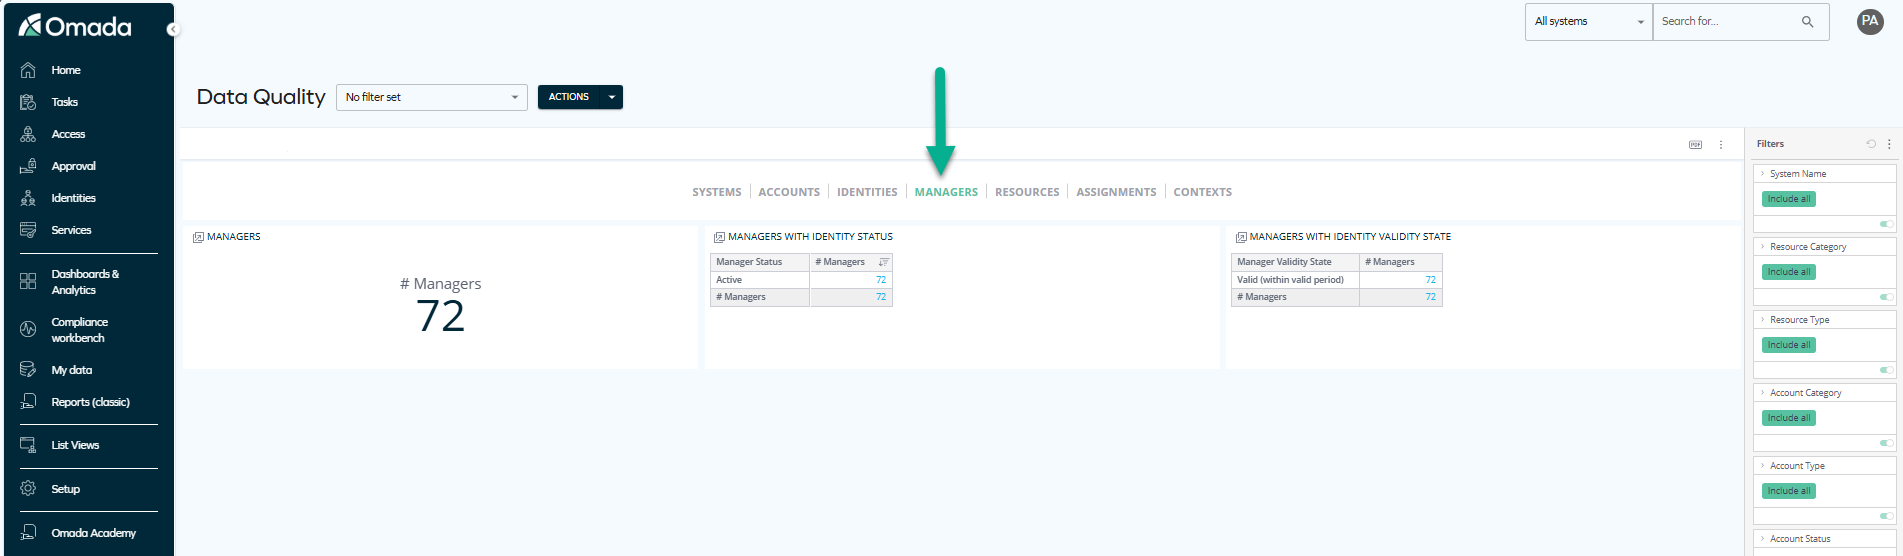
You can switch between the tabs by clicking on the tab names at the top of the dashboard:

You can either browse all tabs to get a high-level overview of potential issues – or apply specific filtering (for example, by context or system) early on and analyze data from this perspective.
Navigating through data
The following sections describe navigation and filtering capabilities available within this dashboard, as well as the data model that this dashboard is based on. Read on to learn how to explore the data in depth while selecting the exact navigation capabilities that best suit your needs, or combining them for a more comprehensive analysis.
Jump-to dashboards
Some widgets are jumpable: when you click them, you can jump to another dashboard that provides more details about the data displayed in the widget. This allows you to explore the data in depth and gain deeper insights into potential data quality issues.
You can recognize jumpable widgets by a number of characteristics:
-
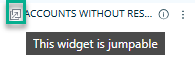
All jumpable widgets have a jumpability icon in the top left corner of the widget.
-
In widgets in the form of charts or cards, the numbers displayed within them can be clickable.
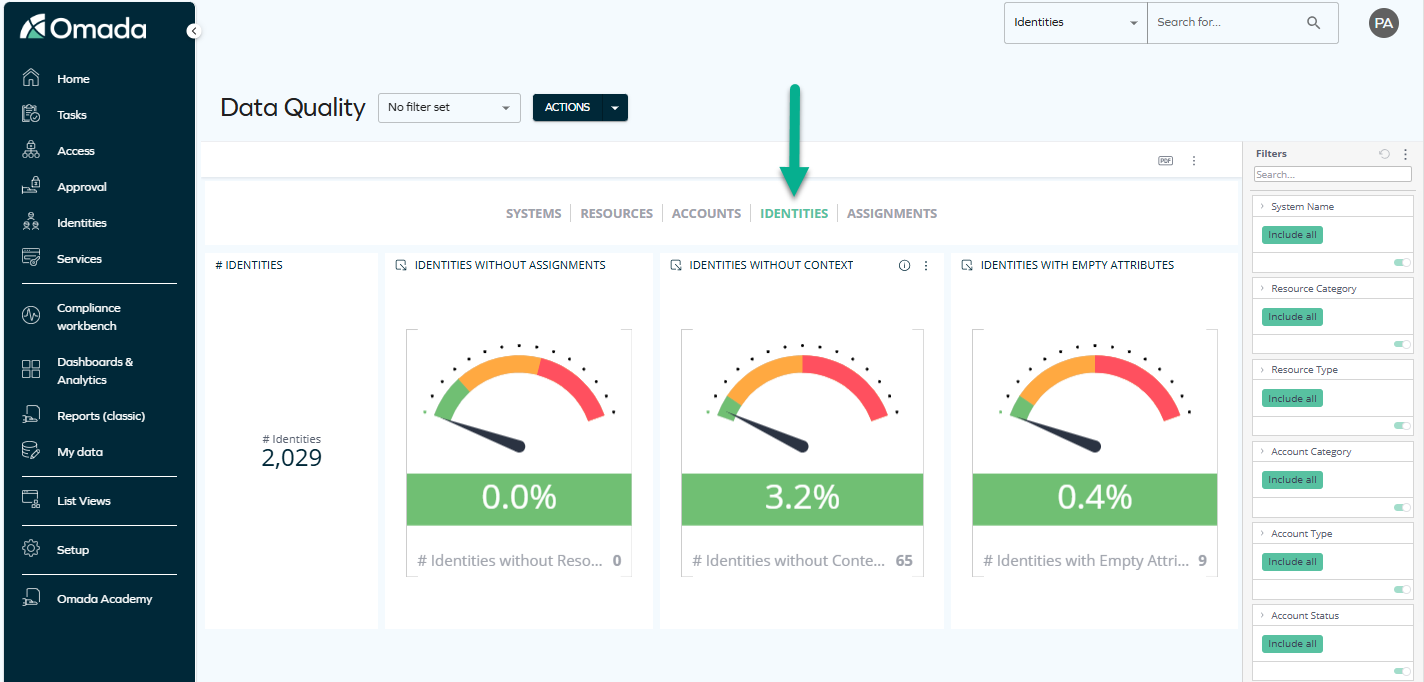
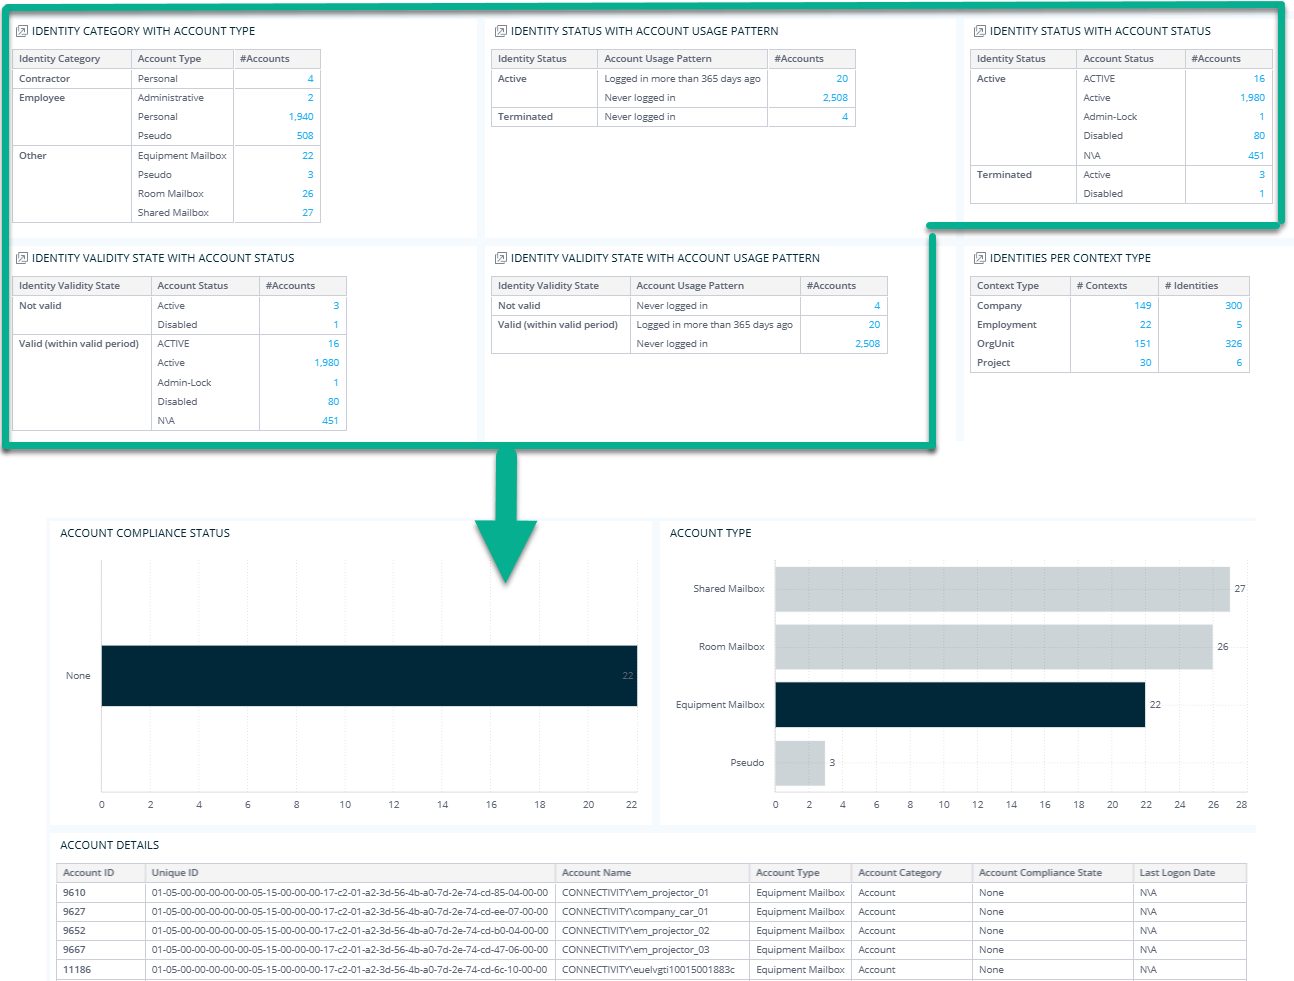
exampleFor example, on the Identities tab, the widget showing the total number of accounts is clickable and jumpable.
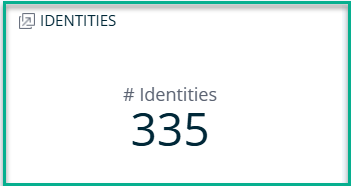
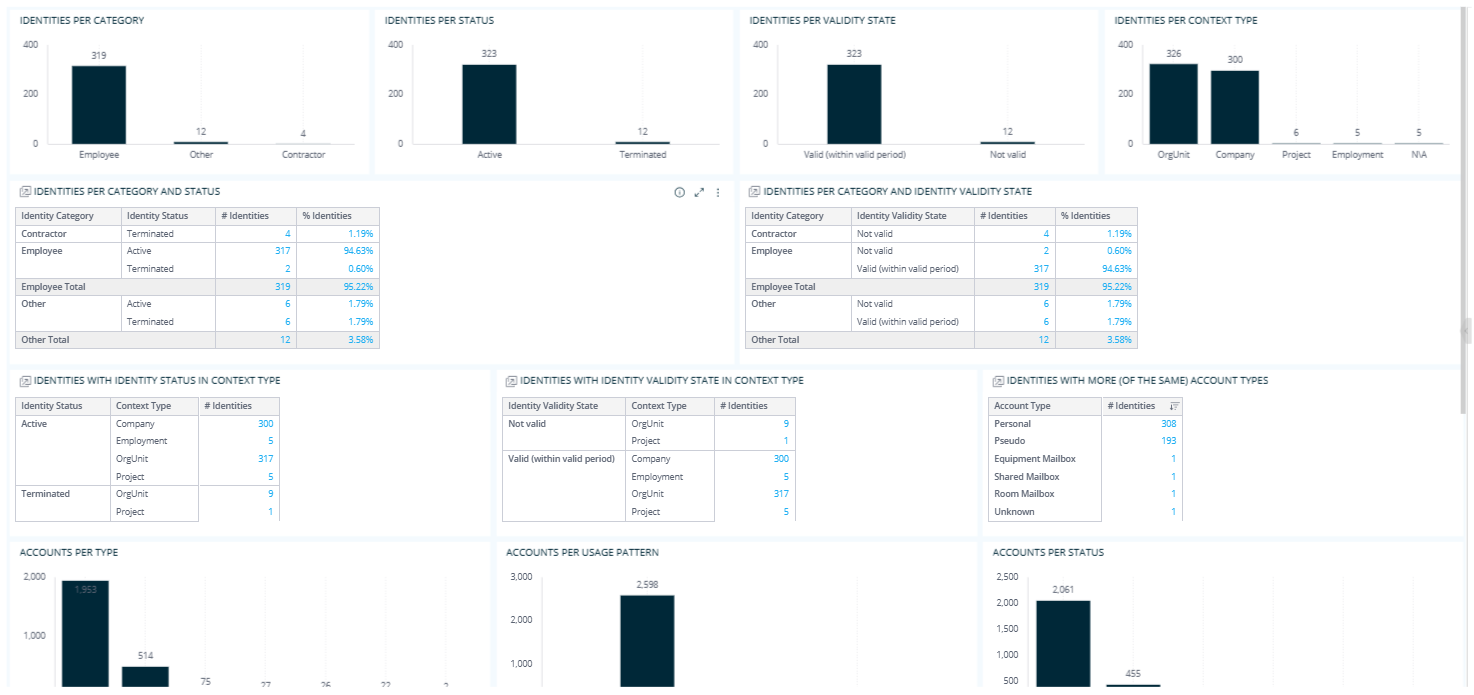
When you click it, you can see a dashboard that shows more details on identities grouped by category, status, validity state, context type, and more:
-
In widgets in the form of tables, some columns contain bright blue clickable numbers displayed within them.
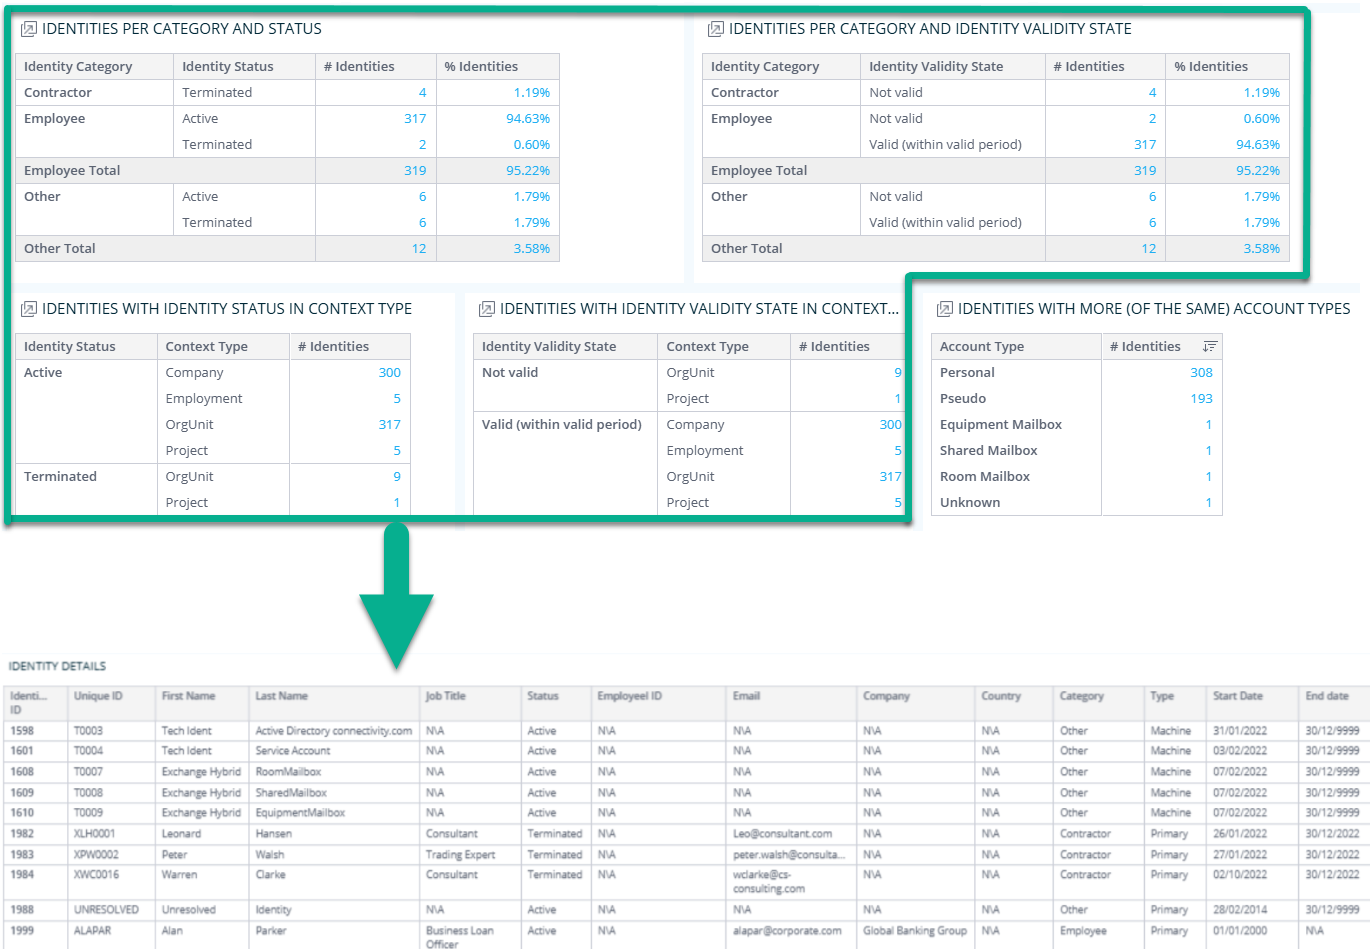
exampleFollowing the previous example, on the Identities tab, the widget showing identities per category and status contains bright blue clickable numbers in the # Identities column. When you click any of these numbers, you will jump to the Identity details dashboard that shows more information about identities with a particular category and status.
Filtering options
The filtering options available within this dashboard can help you narrow down the data for the purposes of analysis. While you browse through one tab, you can filter the data displayed there with the use of filters in the right pane.
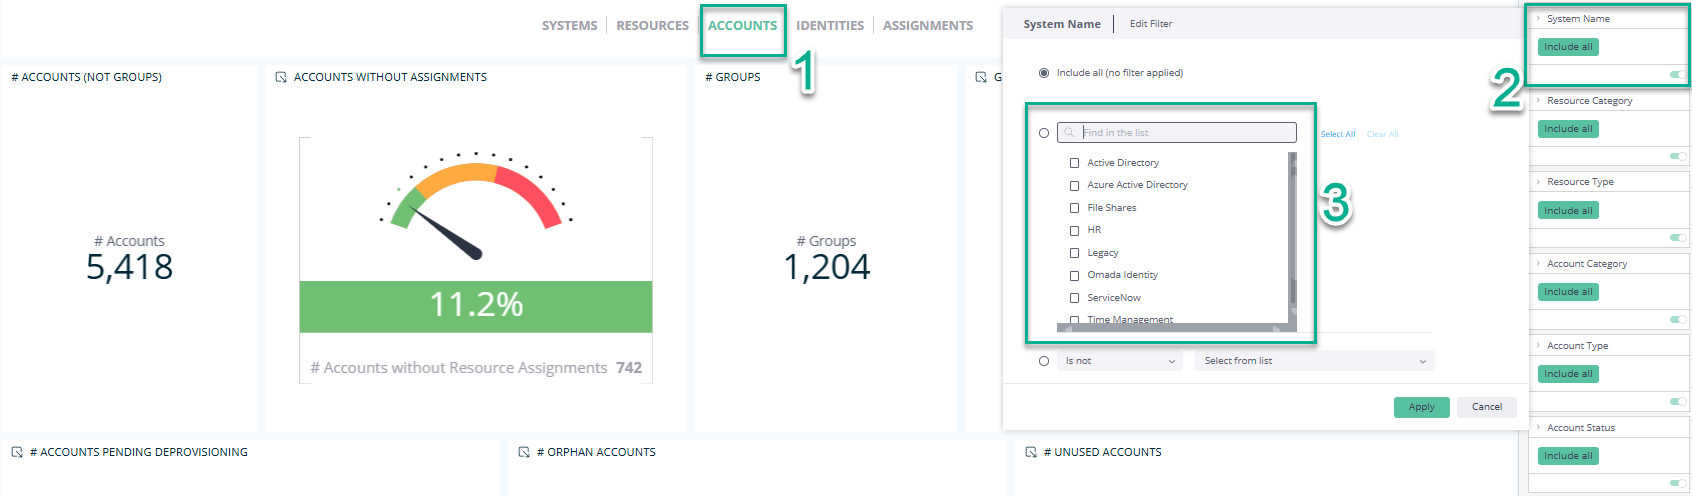
For instance, in the System Name filter in the right pane, you can click Include all, and select a particular system in order to only see the accounts from this system on the tab:
In the same way, you can also decide to only view a particular resource type, account compliance, identity status, and more.
For more information on the filtering options available within this dashboard, read below:
Filtering options
The information displayed on each tab changes according to the filtering that you apply. For example, if you select a particular system name or identity country while viewing one tab, the information on other tabs will reflect the same filtering (until you change or clear it).
-
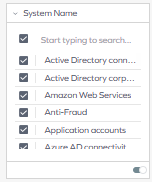
You can enable filtering by selecting an item in the right pane:
-
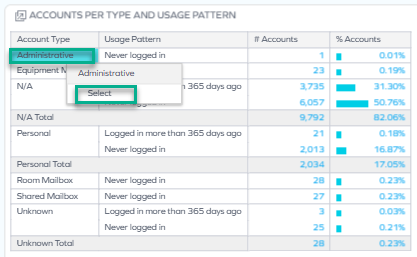
You can also select an item in a table by right-clicking it and clicking Select:
-
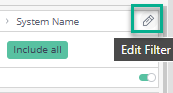
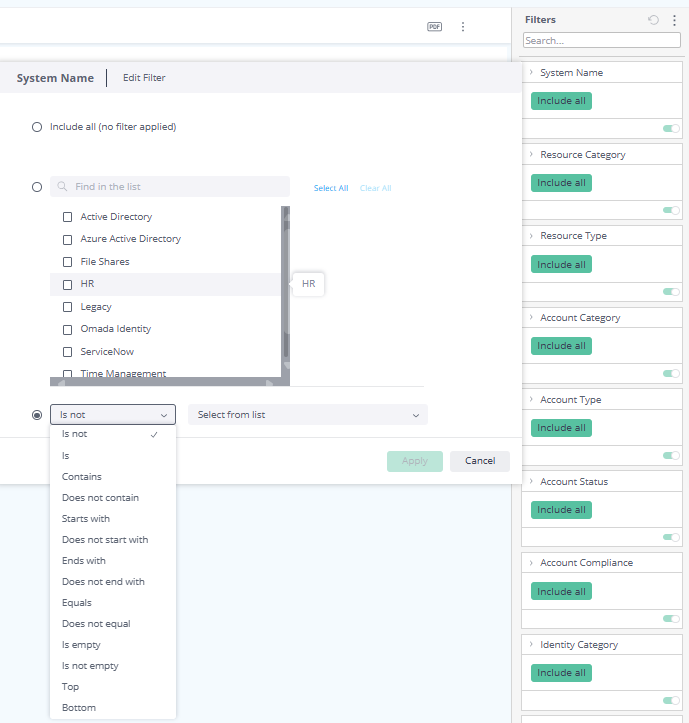
You can edit filters by clicking on the pencil icon, which appears when you hover over the top right corner of the rectangle:
Then, you can select from a variety of options such as "Is not", "Contains", or "Is not empty":
-
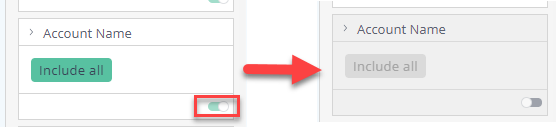
You can disable filtering by disabling the toggle:
-
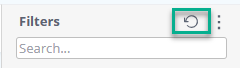
You can reset filtering in the right pane:
Data update cycle and date-based analysis
The data displayed on the Data Quality dashboard reflects the state of the last successful build, which occurs every day after midnight; it is not streamed live. For more information, see the introduction to dashboards: Omada Identity Analytics – Data model.
However, some jump-to dashboards (JTDs) or widgets available through the Data Quality dashboard use a hybrid data model that combines data from the regular daily-built data model with data sourced directly from Enterprise Server (ES) to supplement any gaps. This means JTD data may reflect more recent changes than what is shown on the main dashboards.
Open the dropdown menu to see the list of JTDs that use this hybrid data model.
JTDs that use a hybrid data model
- Accounts Details
- Accounts Details Focus
- Accounts Details Reasons
- Accounts Multiple Details
- Assignments Details
- Assignments Details Focus
- Assignments Details Reasons
- Context Details
- Identity Accounts Details Focus
- Identity Context Details
- Identity Details
- Identity Details Focus
- Identity Multiple Accounts
- Manager Details Focus
- Resource Details
- Resource Details Focus
- Systems Details
Selecting time frames with the date picker
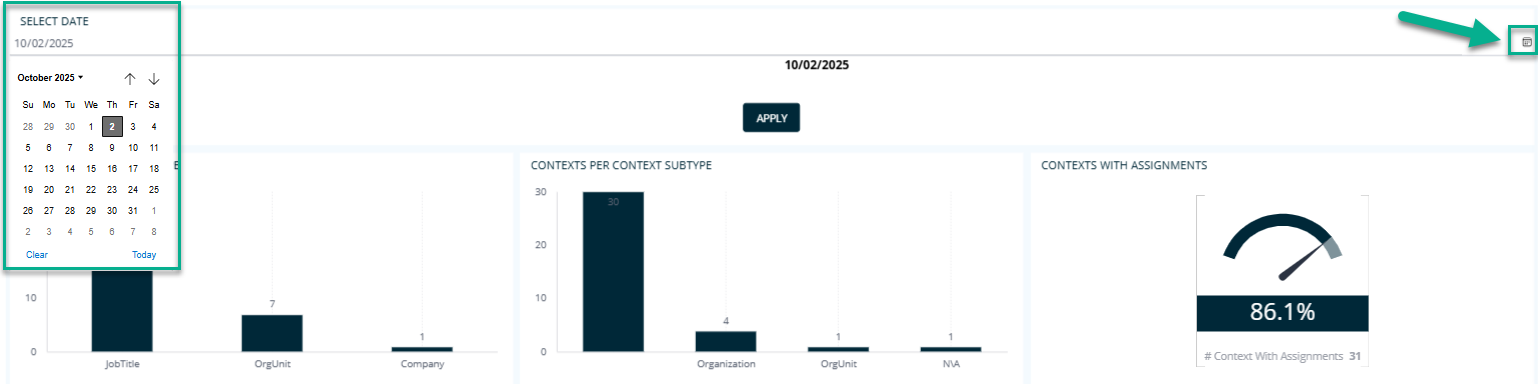
When exploring some jump-to dashboards inside Data Quality, you can also view historical data. Open a widget by clicking it and select the calendar icon. A date picker opens, making it possible to select any date of your choice:
Tabs
The following sections describe all tabs and the widgets available within them.
Systems tab
Use this tab to identify data quality issues related to systems, such as systems that have no resource assignments.
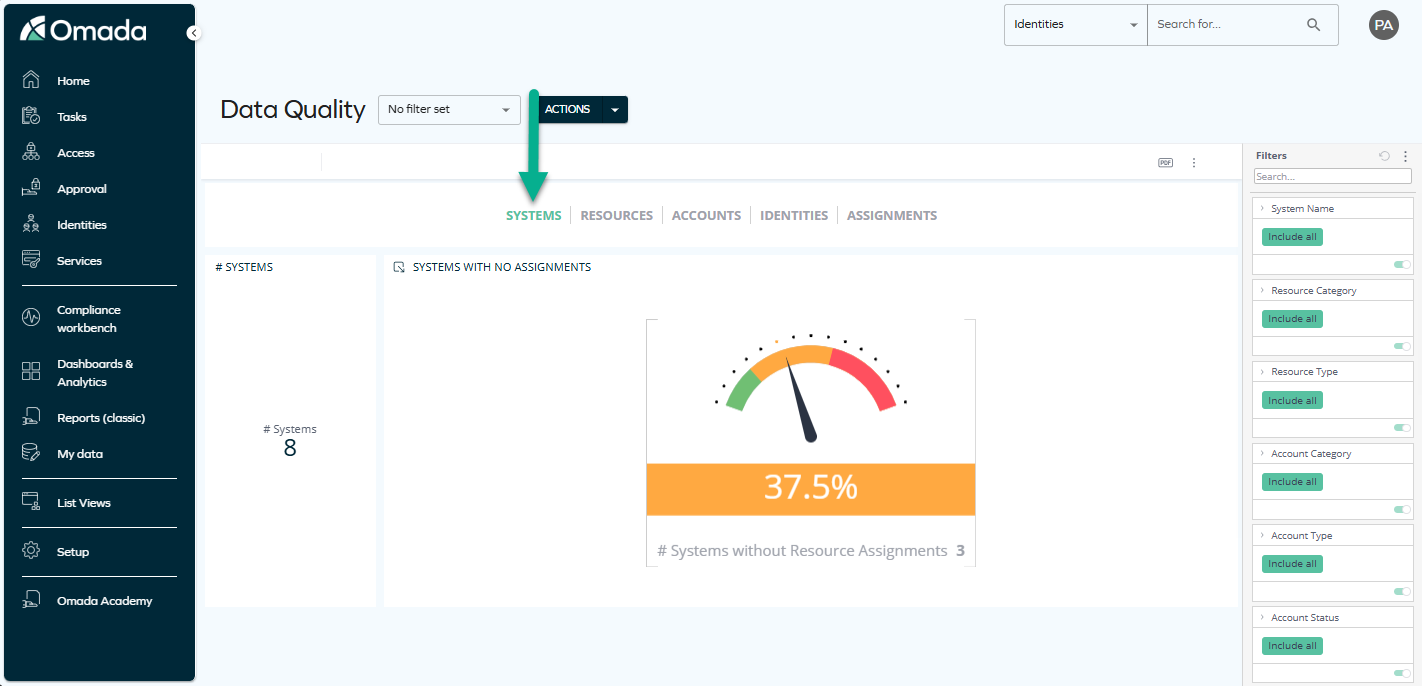
This tab shows the following widgets:
- The numbers of resource assignments per system
- The total number of systems
- The percentage and total number of systems without resource assignments
The last two widgets are jumpable: when you click them, you can see another dashboard that presents system classification tabs, system types, and other system details.
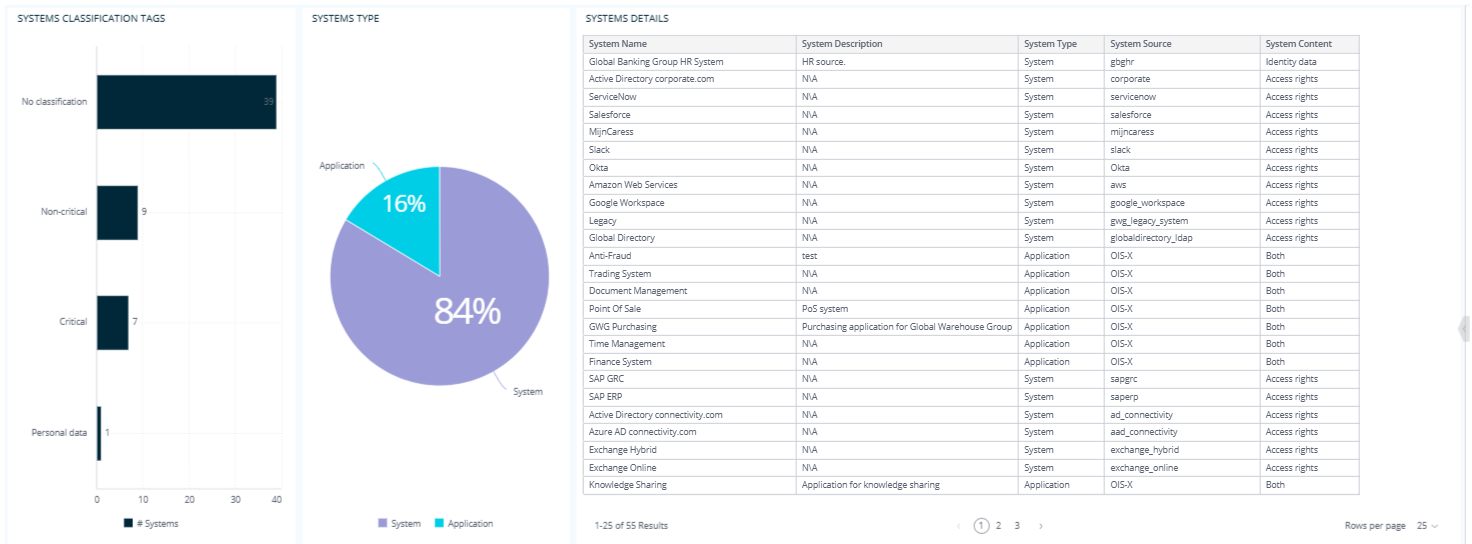
Systems: use case example
You're using the Systems tab to spot that a number of systems have no resource assignments, which is a possible gap in your access governance. By browsing through the widgets, you drill into system types and classifications, uncovering that key HR and Finance systems are affected. This lets you take immediate action to close the gap.
Accounts tab
Use this tab to detect account-level data quality issues, such as accounts without owners, accounts never used, or accounts pending deprovisioning.
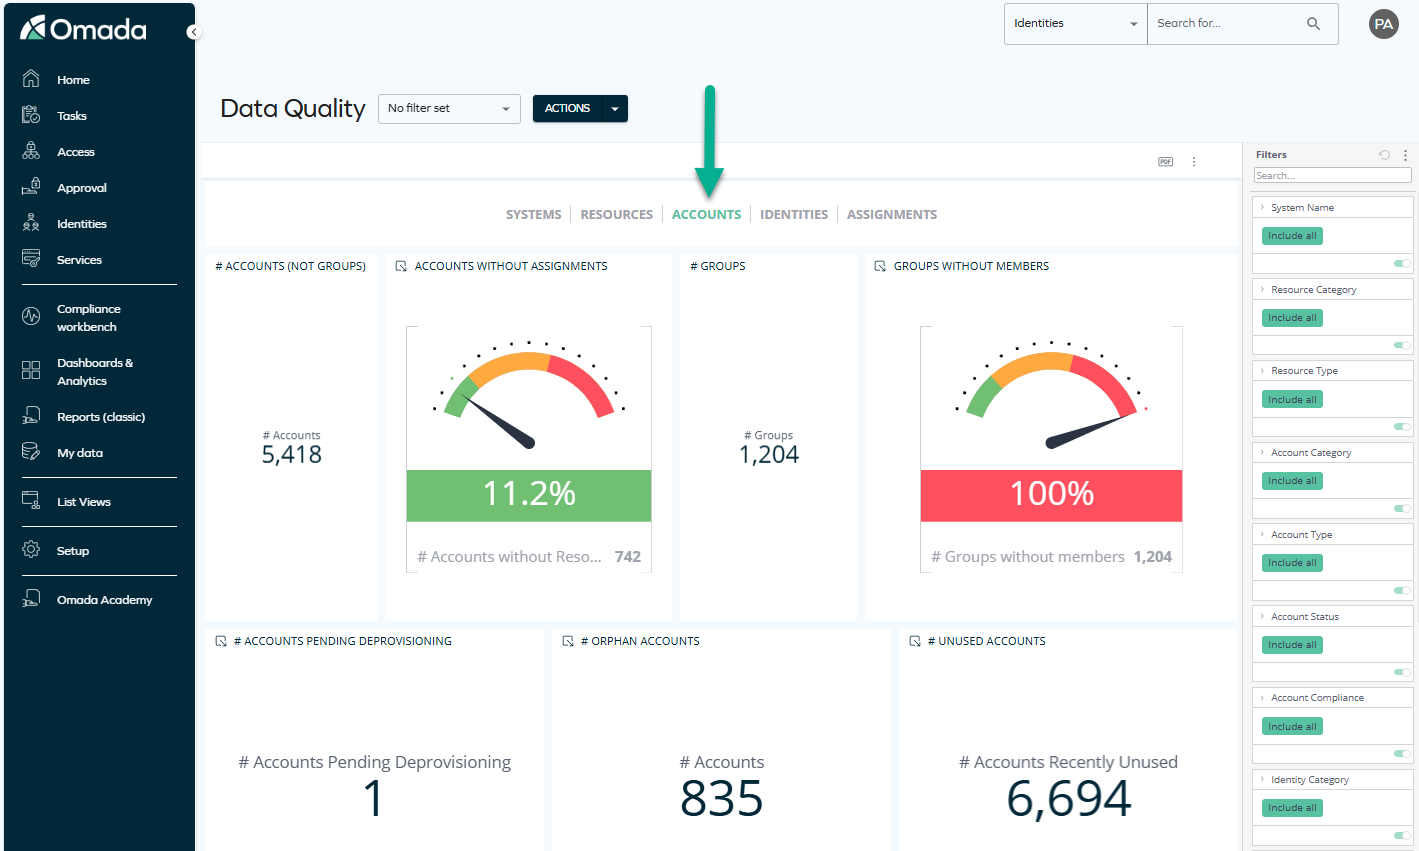
The first widget on this tab displays:
-
The total number of accounts
noteThis widget is jumpable: when you click it, a new dashboard opens, letting you explore more details on accounts grouped by matching status, type, or usage pattern.
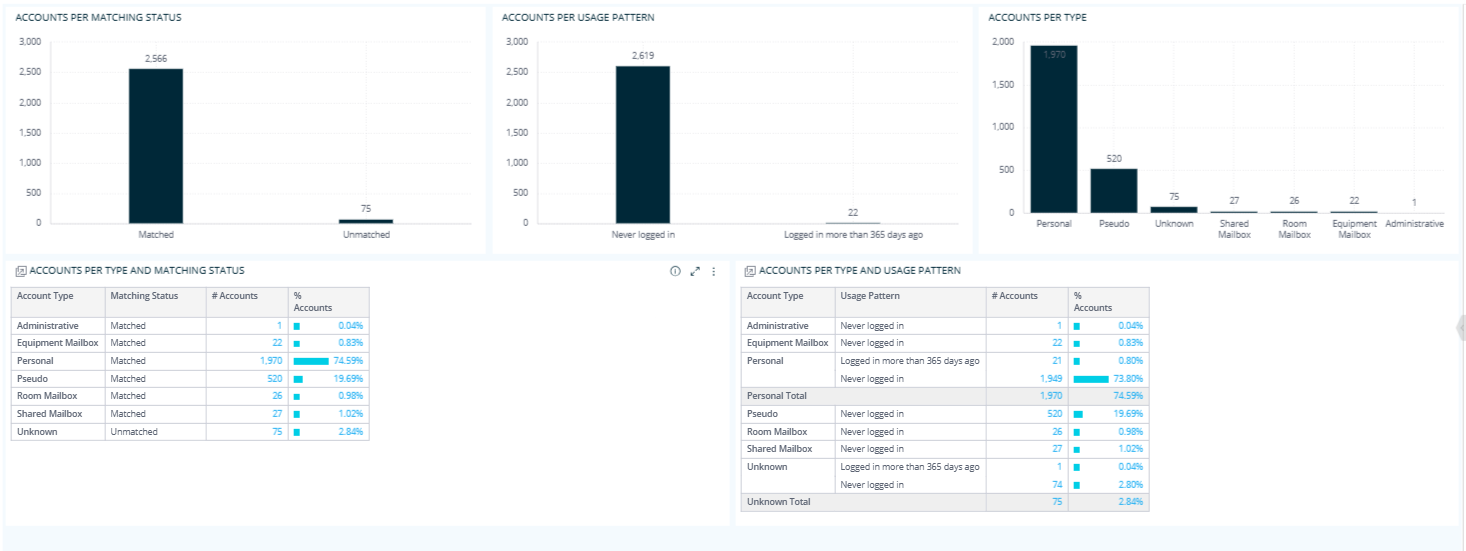
The Accounts per type and matching status and Accounts per type and usage pattern widgets are also jumpable: when you click the bright blue numbers in the widgets, a new dashboard opens, letting you explore more details on accounts grouped by type and matching status.
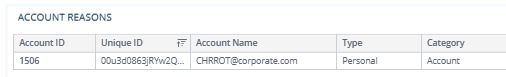
On this dashboard, the Account details table is also jumpable: when you right-click any bright blue item in the Reasons column, you can jump to the Account reasons dashboard.
The next widgets show the percentage and total number of:
-
Accounts without resource assignments
-
Accounts without owners
-
Accounts pending deprovisioning
-
Accounts recently unused (for the last 7 days)
-
Accounts never used
-
Accounts that expire in the next 30 days
-
Accounts without password change in the last 7 days
-
Accounts that never expire
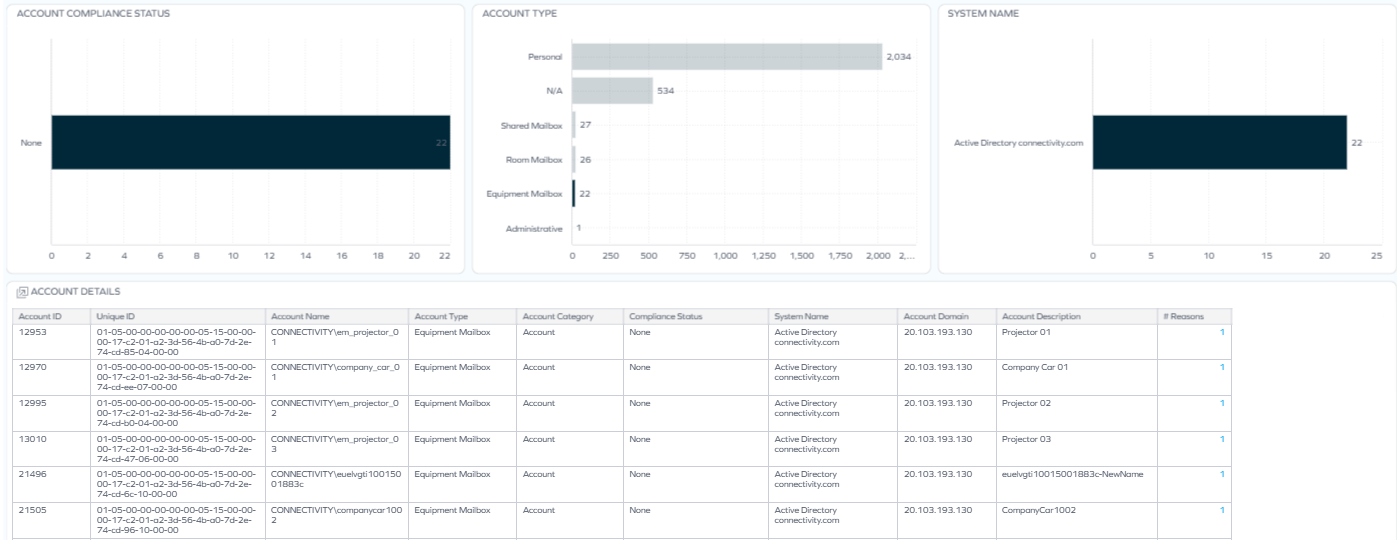
noteWhen you click any of these 8 widgets, a new dashboard opens, letting you explore more details, including the account compliance statuses, account types, system names, and account details.
Inside this dashboard, the Account details table is also jumpable: when you right-click any item in the Reasons column, you can jump to the Account reasons dashboard.
Accounts: use case example
You're using the Accounts tab to check the number of accounts and quickly spot that a high number lack owners or have not been used in weeks. By exploring the widgets, you dive into detailed views by account type, system, and compliance status, which helps you identify risky or orphaned accounts and take targeted cleanup actions. This allows you to reduce exposure and improve the overall hygiene of your data.
Identities tab
Use this tab to surface data quality issues in your identity data, such as identities missing managers, context assignments, or linked accounts.
The first widget on this tab shows:
-
The total number of identities
This widget is jumpable: when you click it, a new dashboard opens, letting you explore more details on identities grouped by category, status, validity state, context type, and more.
Some of the widgets within this dashboard are also jumpable, and they contain widgets that are jumpable, too.
-
If you click the blue numbers on the following widgets:
- Identities per category and status,
- Identities per category and identity validity state,
- Identities with identity status in context type,
- Identities with identity validity state in context type,
you will jump to the Identity details dashboard.
-
If you click the blue numbers on the following widgets:
- Identity category with account type,
- Identity status with account usage pattern,
- Identity status with account status,
- Identity validity state with account status,
- Identity validity state with account usage pattern,
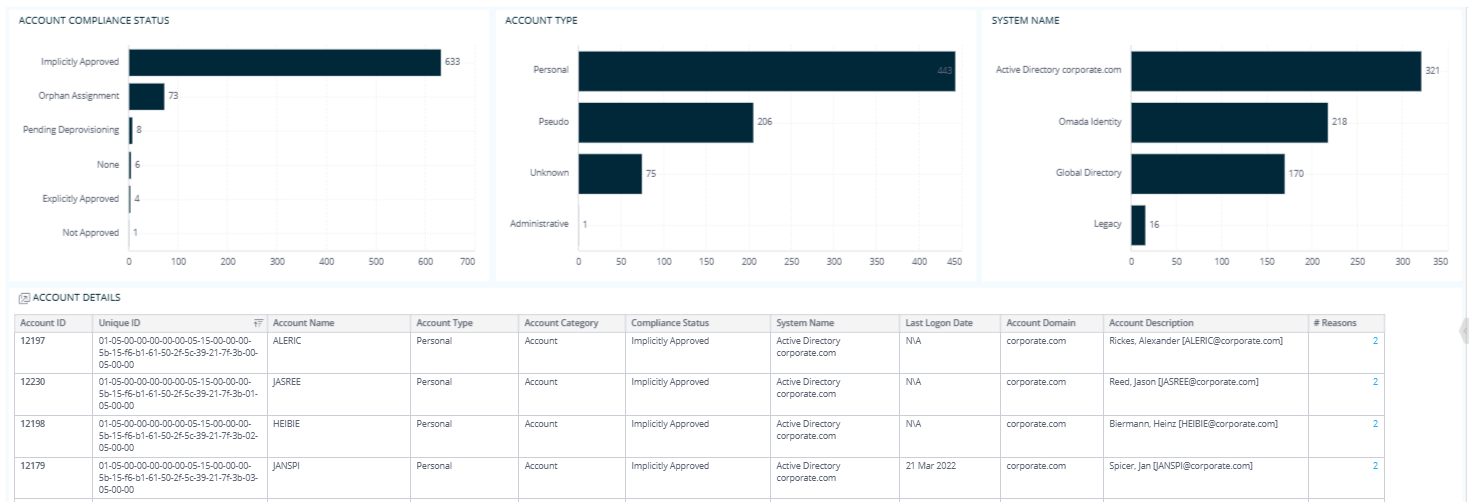
you will jump to a dashboard displaying data related to the Account compliance status, Account type, and Account details.
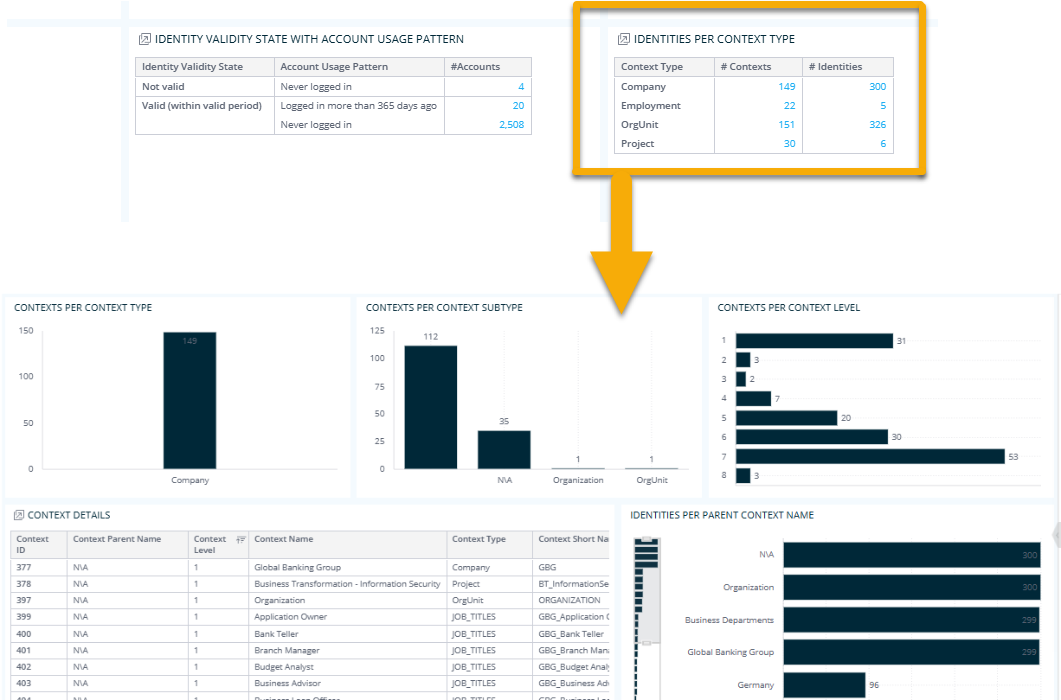
-
If you click the blue numbers on Identities per context type, you will jump to the Identity details dashboard.
-
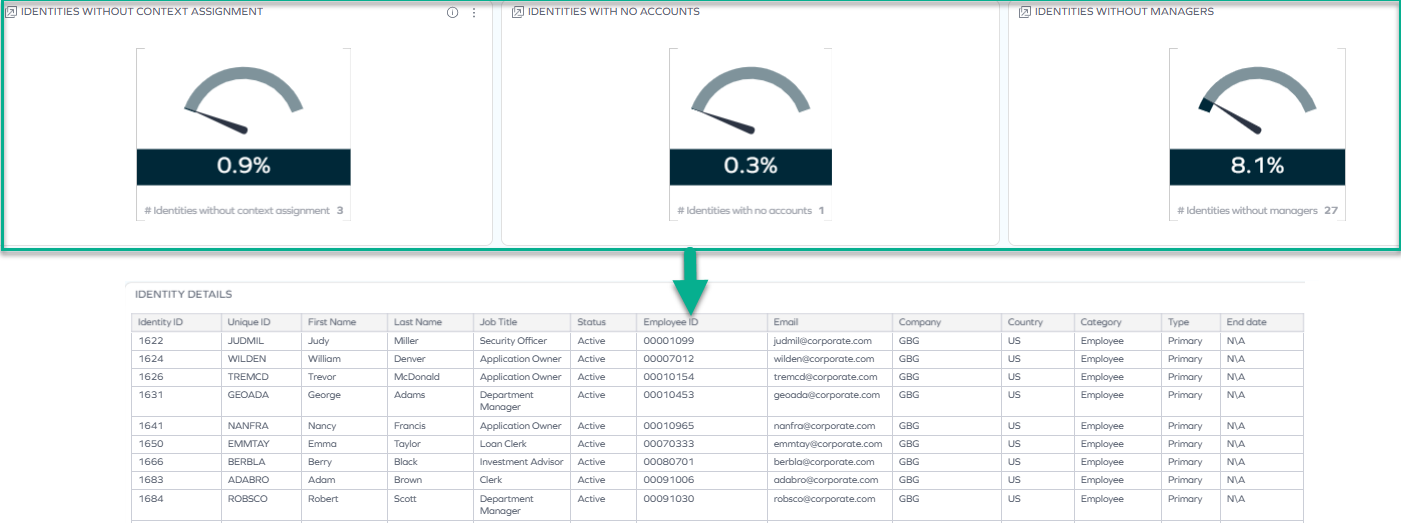
The next 8 widgets on the Identities tab show the percentage and total number of:
-
Identities with empty attributes
-
Identities without resource assignments
-
Identities without context assignment
-
Identities with no accounts
-
Identities without managers
-
Identities with terminated managers
-
Identities recently unused
-
Terminated identities with active accounts
When you click any of these widgets, you can jump to the Identity details dashboard, which lets you explore identities in depth.
The last widget on the Identities tab shows the total number of:
-
Identities with multiple accounts of the same type
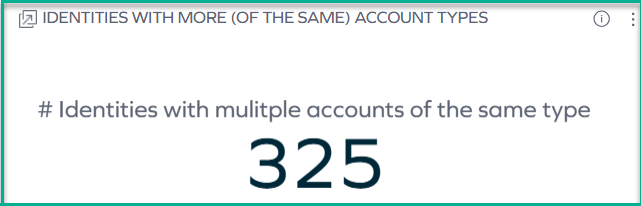
If you click it, you will jump to a list of such identities with additional details.
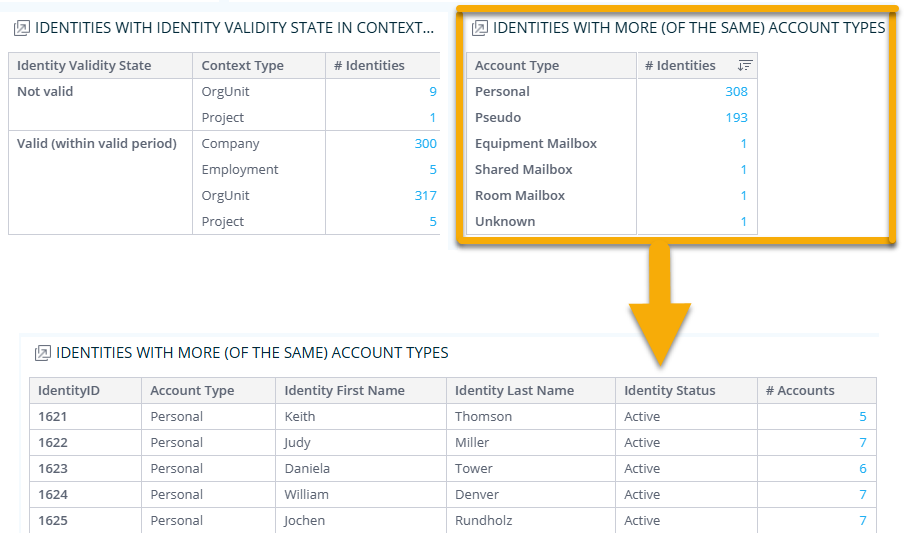
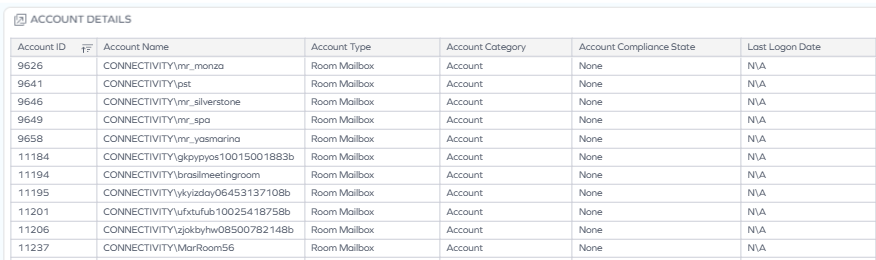
From this widget, you can also jump to Account details.
Identities: use case example
You check the Identities tab to get a clear picture of your identity landscape and quickly notice that a number of identities lack managers or have no accounts at all. Thanks to the widgets available, you can access detailed breakdowns by status, category, and context, helping you detect data gaps or broken reporting lines. This allows you to take corrective actions, such as assigning managers or investigating orphaned identities, which ultimately improves the overall quality and reliability of your identity data.
Managers tab
Use this tab to review the health of your manager data, including managers whose identity status is terminated or whose validity state has expired.
The widgets on this tab display:
-
The total number of managers
-
The number of managers per their identity status
-
The number of managers per their validity state
noteWhen you click the first widget, or right-click any item of the other two widgets, you can jump to the Manager details dashboard, which displays more information about the managers: for example, the number of identities managed by them.
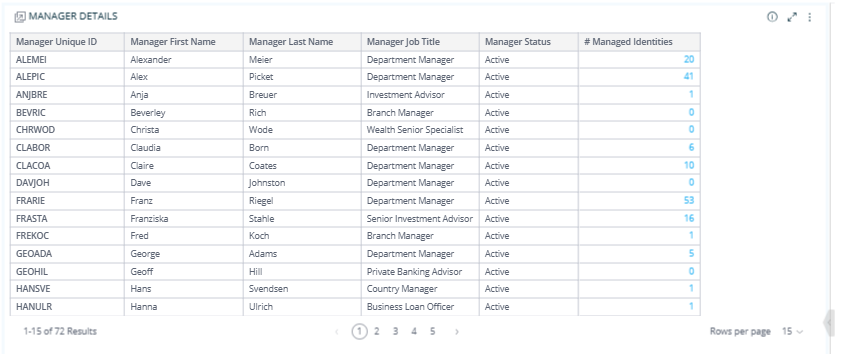
If you right-click any item in the # Managed identities column, you can jump to the Identity details dashboard that shows the details of the identities managed by a particular manager.
Managers: use case example
You're using the Managers tab to review if there are any terminated (not valid) managers who still manage active identities. By interacting with the widgets, you identify such managers and jump to detailed views showing which identities they manage. This helps you quickly spot gaps and reassign responsibilities where needed to keep reporting structures intact.
Resources tab
Use this tab to spot data quality issues related to resources and groups, including those that are unassigned or have no designated owner.
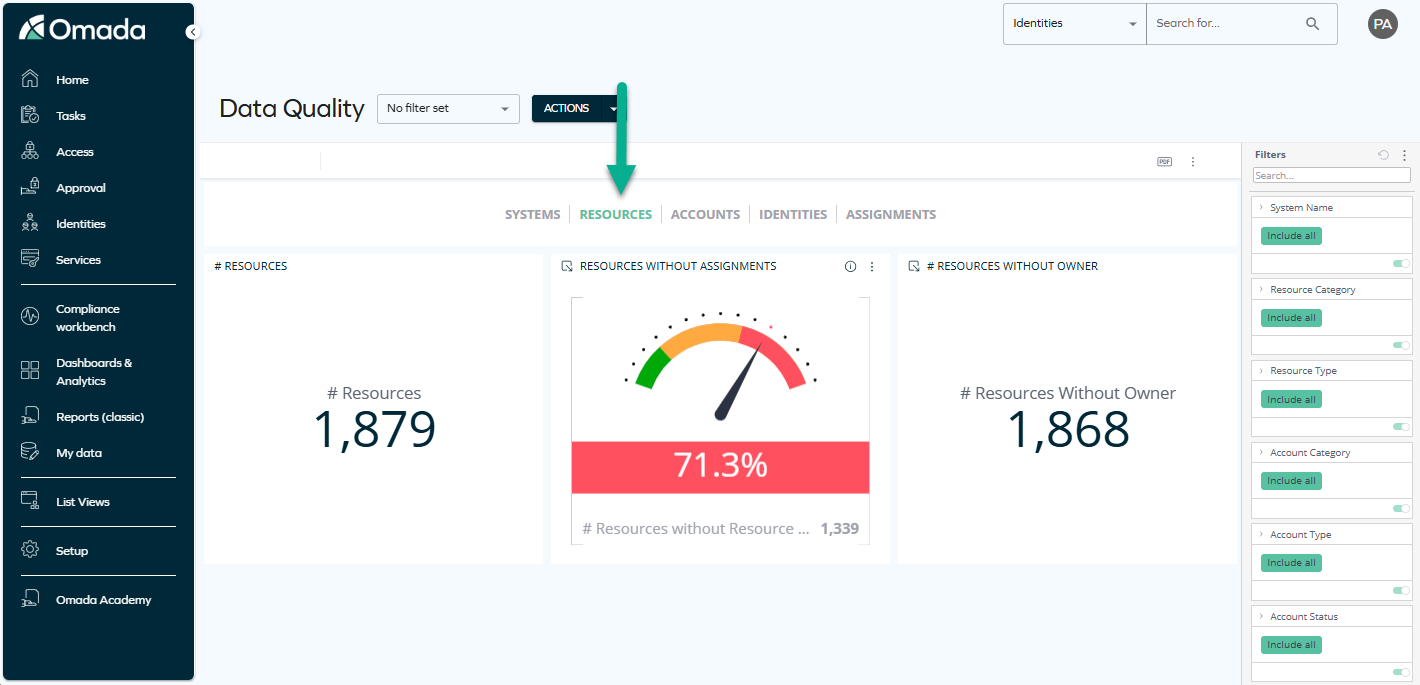
The widgets on this tab show:
-
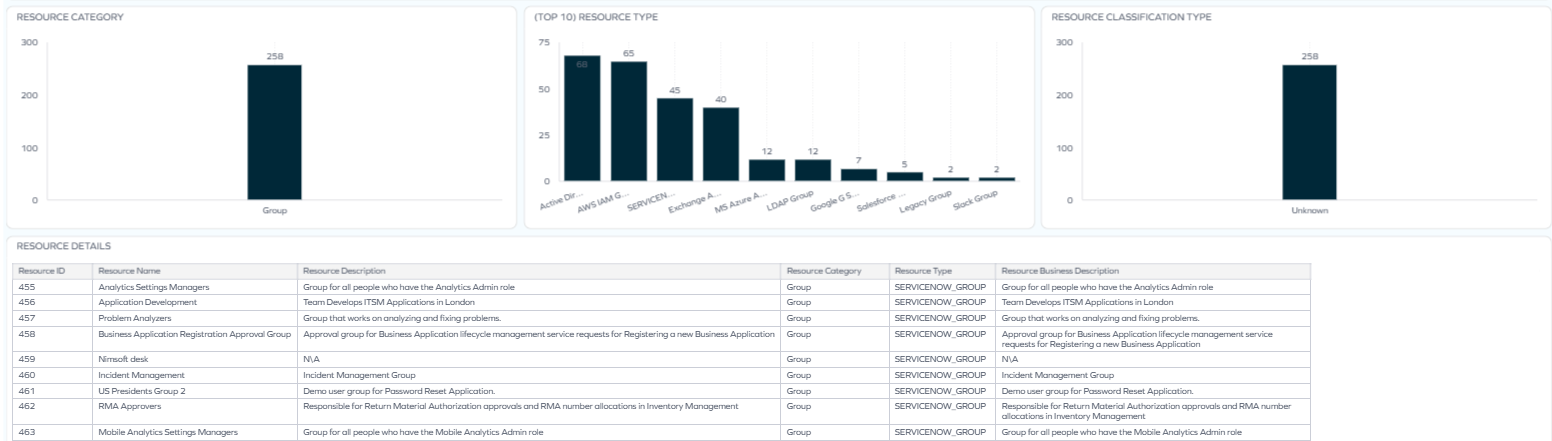
The total number of resources and the total number of groups.
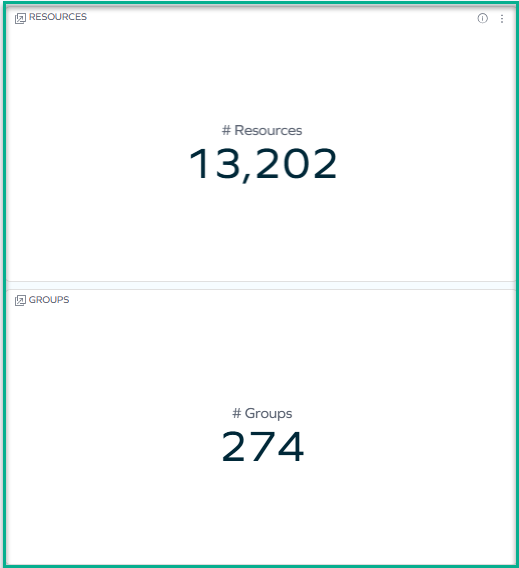
When you click any of these two related widgets, you can jump to another dashboard that shows the number of resources per resource category and per resource classification status.
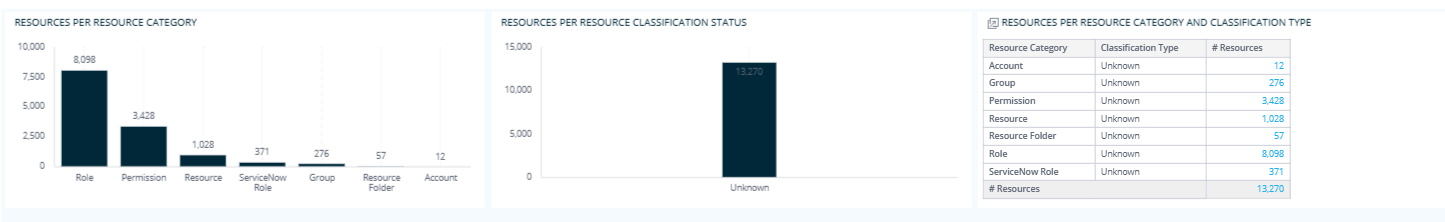
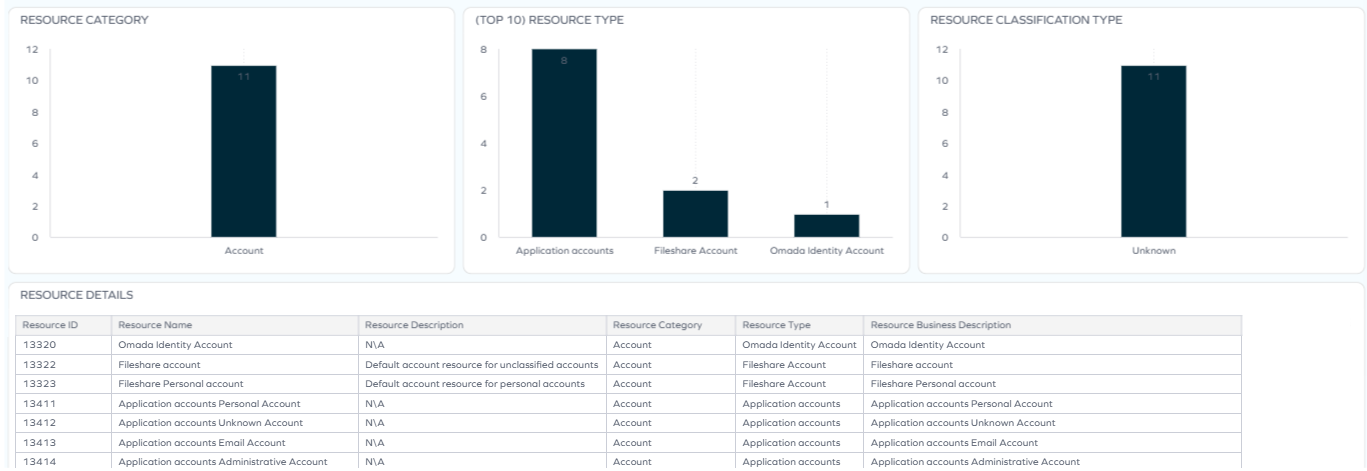
When you click any item in the # Resources column of this dashboard, you can jump to a dashboard that shows resource details such as resource type, resource category, and more.
-
Resources without assignments, resources without owners, groups without members, groups without owners
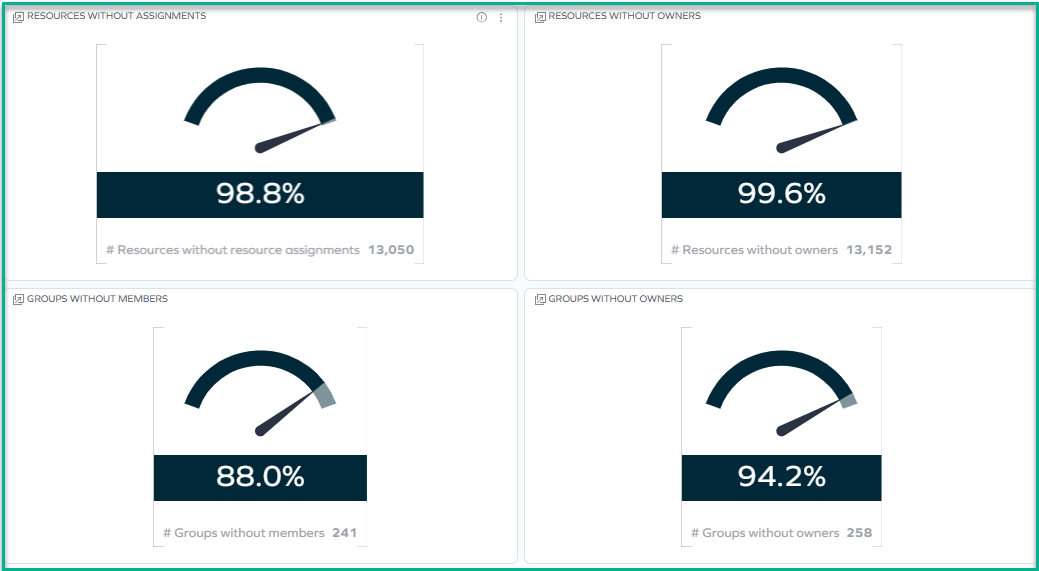
When you click any of these four related widgets, you can jump to another dashboard that shows more details on resource categories, types, and classification types, as well as other resource-related details.
Resources: use case example
While reviewing the Resources tab, you uncover issues like unassigned resources or orphaned groups that could lead to unmanaged access. By clicking through the widgets, you narrow down to categories, types, and classification statuses to pinpoint where ownership or assignment is missing. This helps you strengthen control over entitlements and reduce access-related risks.
Assignments tab
Use this tab to analyze data quality issues in resource assignments, such as dual assignments or assignments that are pending deprovisioning.
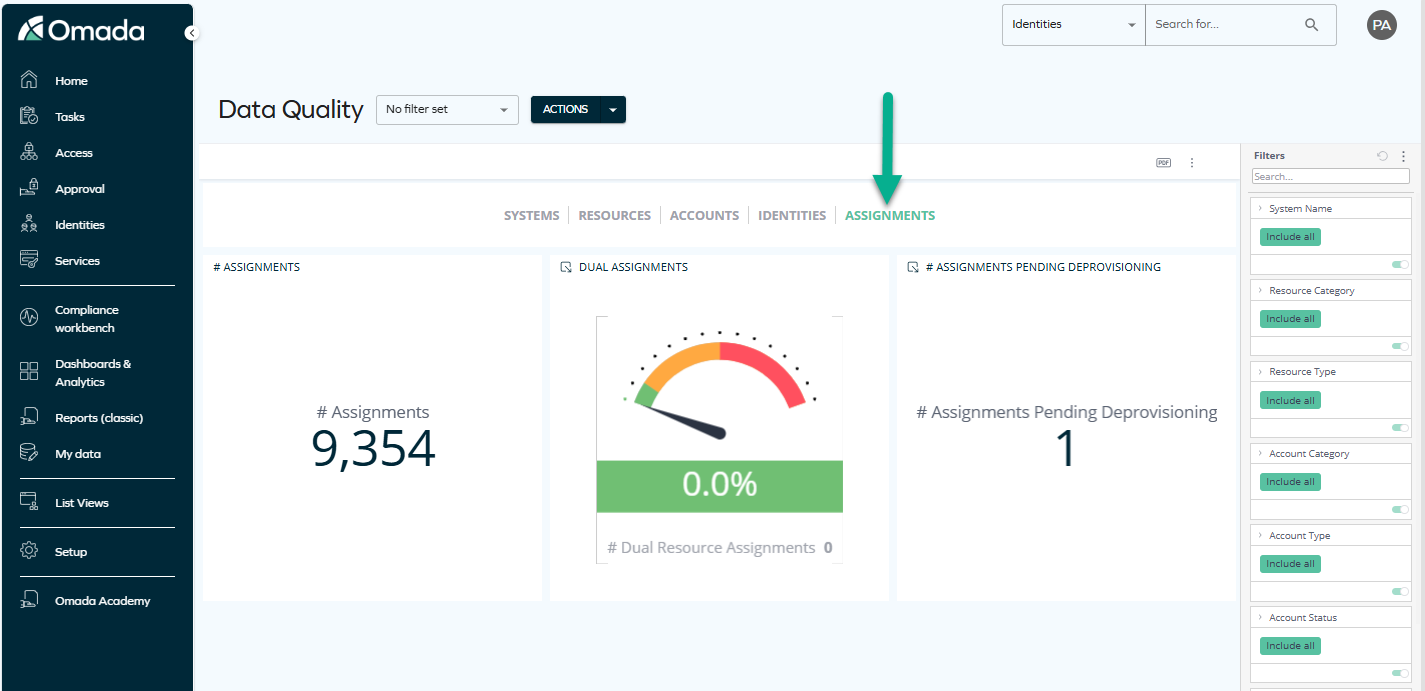
The widgets on this tab display:
-
The total number of assignments
When you click this widget, you can explore more resource assignment-related details, such as the number of indirect resource assignments or the number of resource assignments per resource category.
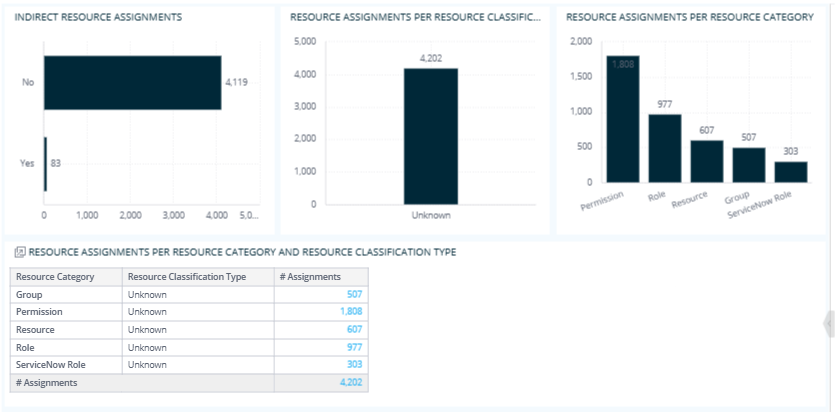
When you click any item in the # Assignments column of the Resource assignments per resource category and resource classification type dashboard, you can jump to the Assignment details dashboard that shows details of resource assignments such as assignment type, resource category, and more.
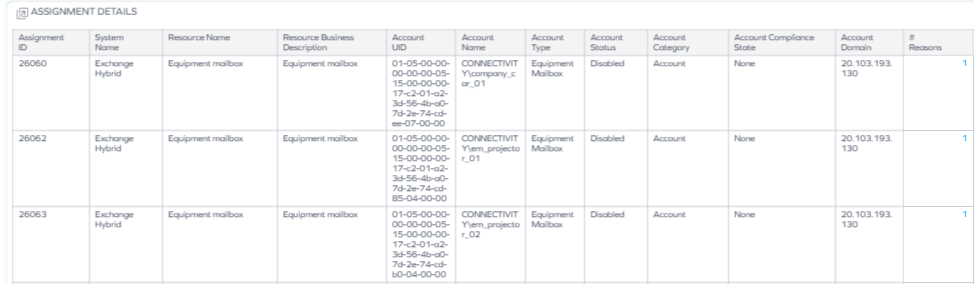
This dashboard is also jumpable: when you right-click any item in the Reasons column, you can jump to a dashboard that shows details of reasons for assignments.
-
The percentage and total number of dual assignments (meaning those that are both explicitly and implicitly assigned).
-
The number of assignments pending deprovisioning.
noteWhen you click any of the last two widgets, you can jump to the Assignment Details dashboard, which displays even more valuable assignment-related data.
Assignments: use case example
After an organizational change, you use the Assignments tab to check for assignments pending deprovisioning, ensuring access is removed from users who have changed roles or left the company. By diving into the assignment details and reasons, you identify lingering entitlements tied to outdated roles. This helps you prevent unauthorized access and maintain compliance with internal security policies.
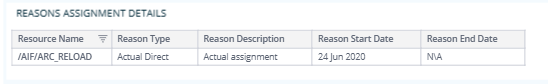
Contexts tab
Use this tab to identify data quality issues related to contexts, such as contexts that have no owner or no assignments.
This tab contains widgets that display:
-
The total number of contexts
-
The percentage and total number of contexts with no owner
-
The total number of context assignments
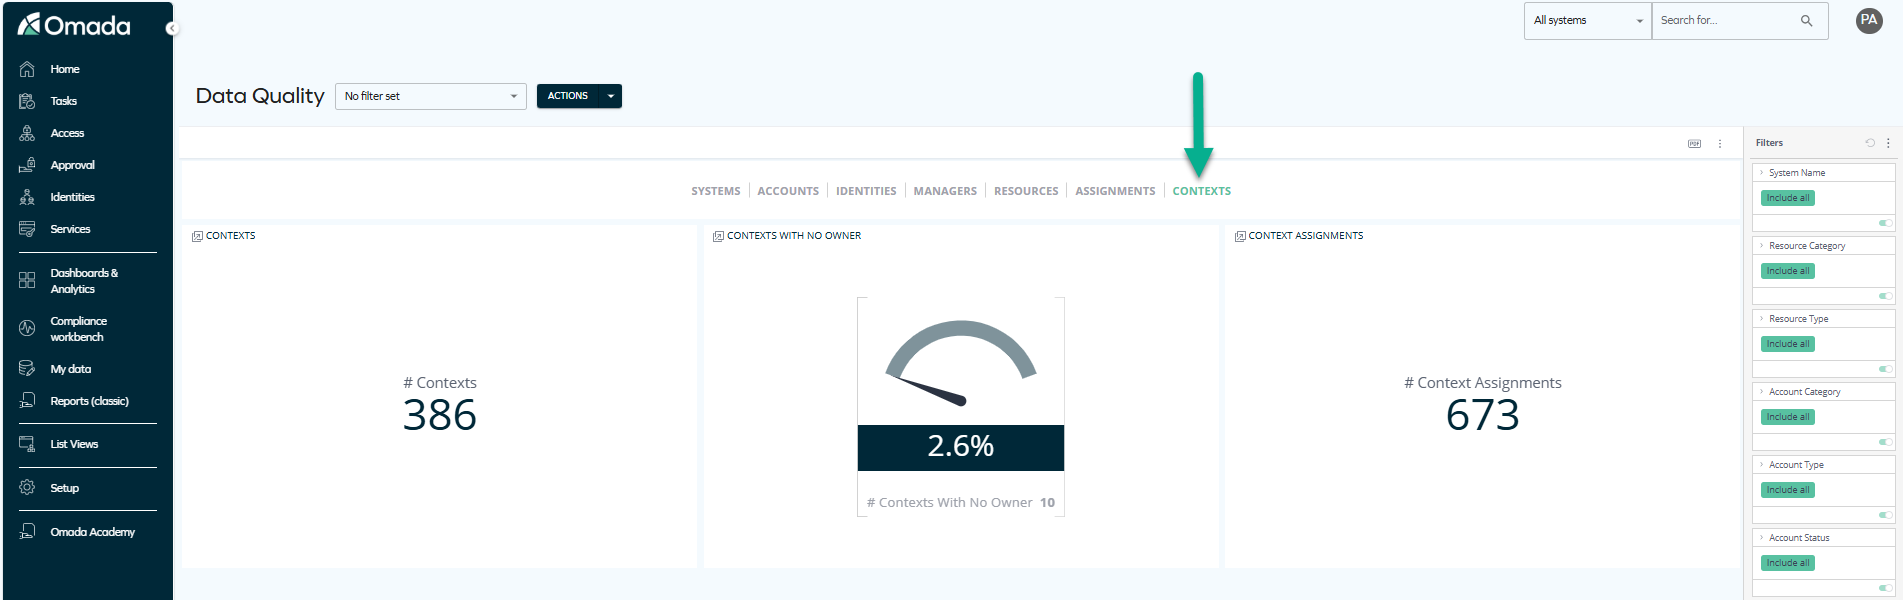
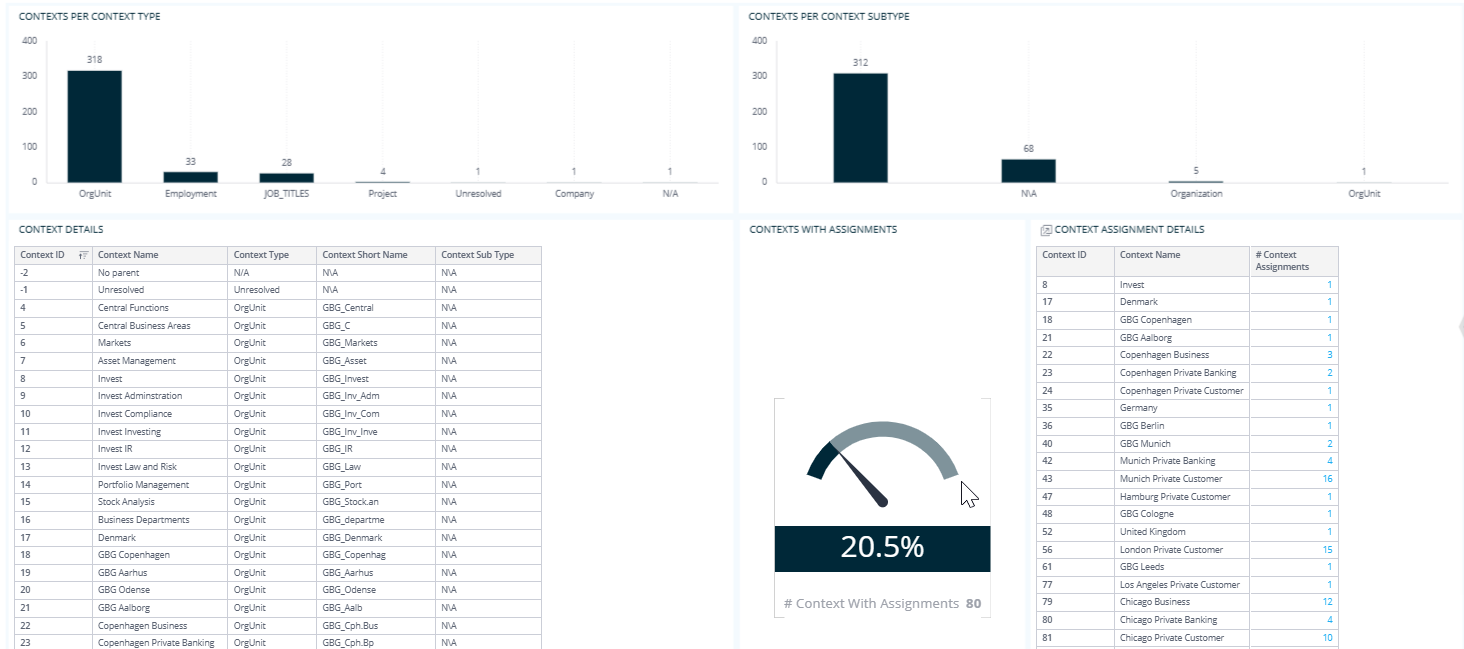
noteWhen you click any of these widgets, you can jump to another dashboard that gives an insight into context types, context assignment details, and more.
Contexts: use case example
As part of a periodic data quality review, you use the Contexts tab to identify contexts that have no assignments or no owners. By jumping into the detailed dashboard, you analyze context types and related assignments, which helps you understand where governance gaps exist. This allows you to take corrective actions, such as assigning owners or reviewing the relevance of certain contexts, ultimately improving the overall quality and reliability of your context data.
Downloading and exporting
To export (download) the content of any widget, open the three-dots menu next to it, select Download, and choose a format.
Before you download the content of a widget, read Omada Identity Analytics – Downloading and exporting for details on the available formats as well as their limitations.
Access to this dashboard
To learn which user groups have access to this dashboard, see Access to dashboards.
Parity with legacy SSRS reports
Through this dashboard, as well as a number of other ones, you can access the data that was previously only accessible through the legacy SSRS reports (former Reports (classic) page in Omada Identity).
For a complete list of legacy reports and the current locations of equivalent widgets and dashboards, as well as an example of a business scenario, see the Legacy reports vs. Omada Identity Analytics Platform OIA section of Omada Identity Analytics.