Audit Trail
The Audit Trail dashboard gives a consolidated view of how resource assignment decisions are made, reviewed, and changed across access governance processes.
Overview
This dashboard includes assignment outcomes from access requests, access extension requests, surveys, SoD evaluations, identity-page revocations, and initial verdict decisions. It combines high-level indicators (for example, remediation rate and approval behavior) with detailed assignment records so you can investigate who made a decision, what changed, and when it happened.
Access to this dashboard
To learn which user groups have access to this dashboard, see Access to dashboards.
Widgets
Audit Trail is organized into widgets that provide both high-level summaries and detailed records. Analyzing the data across these widgets can help identify trends, investigate specific access decisions, and evaluate the effectiveness of access policies and controls.
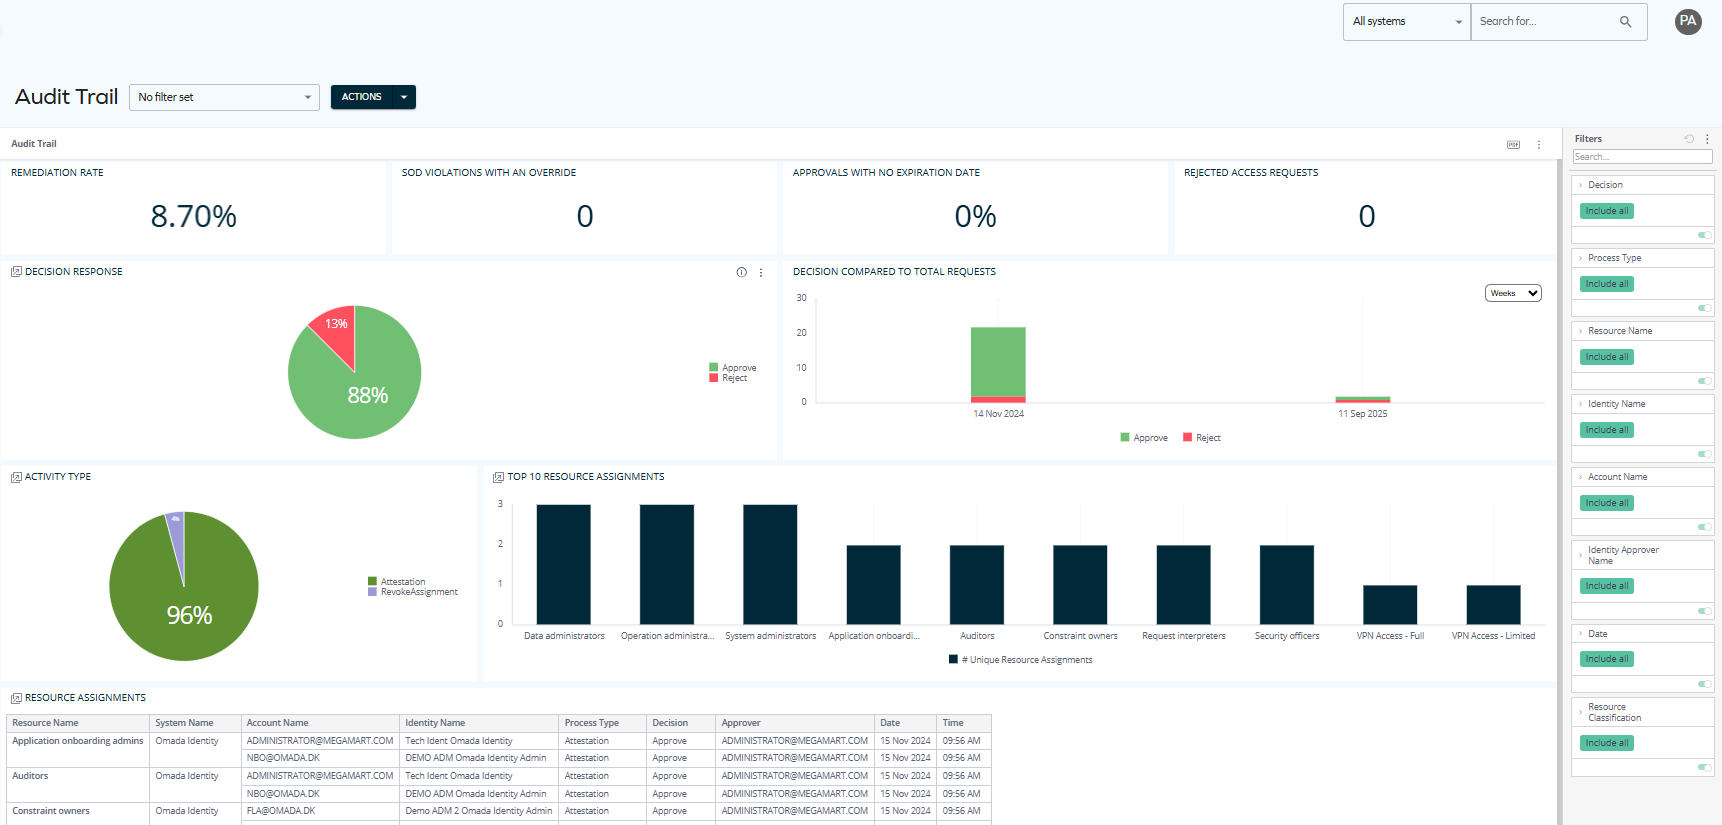
The dashboard includes the following widgets:
-
KPI cards – Four summary metrics displayed at the top:
- Remediation rate – percentage of attestations that were rejected.
- SoD violations with an override – number of Separation of Duties violations where access was granted with an override (despite a conflict).
- Approvals with no expiration date – percentage of approved access requests that were approved despite having no defined end date.
- Rejected access requests – total number of rejected access requests.
-
Charts
- Decision response – pie chart showing the distribution of decisions to grant, revoke, or modify access.
- Decision compared to total requests – bar chart showing trends of decisions affecting resource assignments over time. Available time intervals include days, weeks, months, quarters, and years.
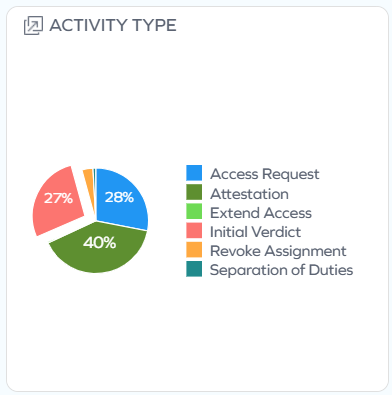
- Activity type – pie chart breaking down activity by type: Access Request, Attestation, Extend Access, Initial Verdict, Revoke Assignment, and Separation of Duties.
- Top 10 resource assignments – bar chart showing the resources with the most audited user activities.
-
Resource assignments table – a detailed audit log of individual resource assignment decisions, including information about the relevant resources, accounts, identities, requestors, systems, processes, decisions, dates, and more.
The widgets on this dashboard are interactive, allowing you to apply filtering and drill down into specific data points for deeper analysis. For details, read on to the next sections.
Narrowing down data by applying filters across widgets
When you spot something interesting on a widget, you can apply filtering to narrow down the data and investigate specific trends or access decisions in more detail.
For example, if you notice a high number of access requests approved without an expiration date, you can click that segment in the pie chart to filter the data across all widgets and analyze related trends and details. Then, you can move on to limiting the date range to see if this is a recent trend or a long-standing issue. At the end of your investigation, you can export the data to share your findings with stakeholders or for further analysis.
The information displayed on each widget may change according to the filtering that you apply to one widget. For instance, if you select any activity type on the pie chart, or any resource assignment on the Top 10 resource assignments chart, the data on other widgets reflects the same filtering (until you change or clear it).
You can enable filtering:
-
By clicking any chosen item (on any widget or chart), for example, a particular activity type.
-
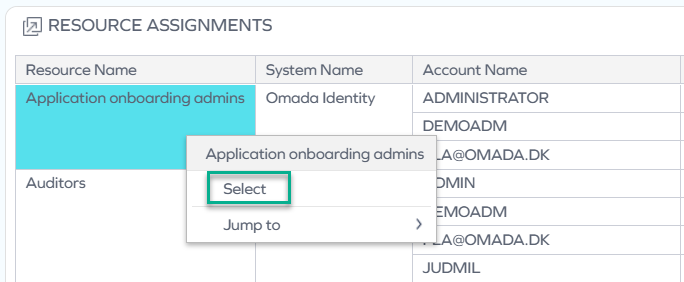
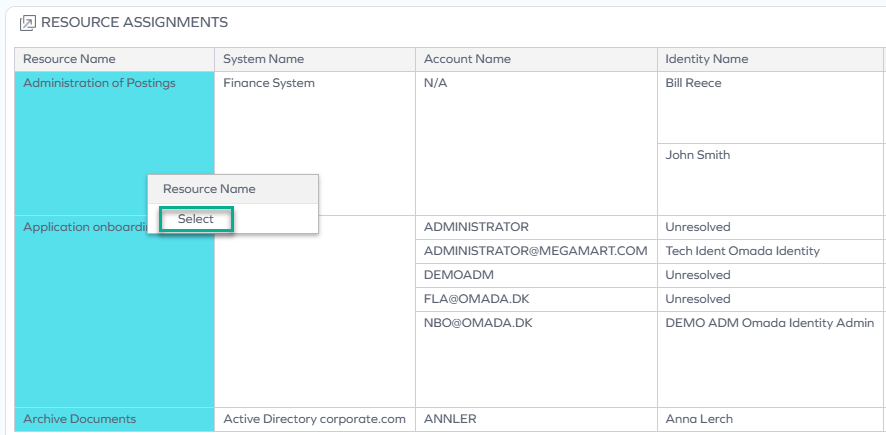
By right-clicking any chosen item and clicking Select.
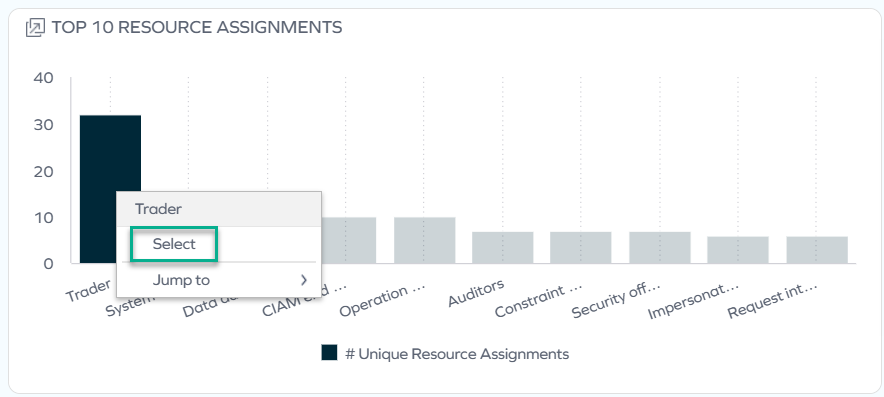
In the same way, you can select an item from a chart.
 tip
tipIf you want to select more than one item to filter by, press the Control key and select as many items as you need:
-
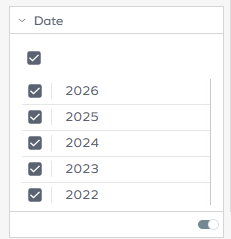
By selecting an item in the right pane.
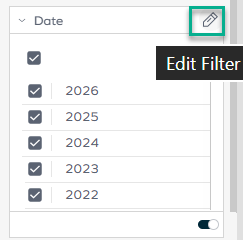
You can also edit the filters you applied:
-
By clicking the pencil icon, which appears when you hover over the top right corner of the rectangle.
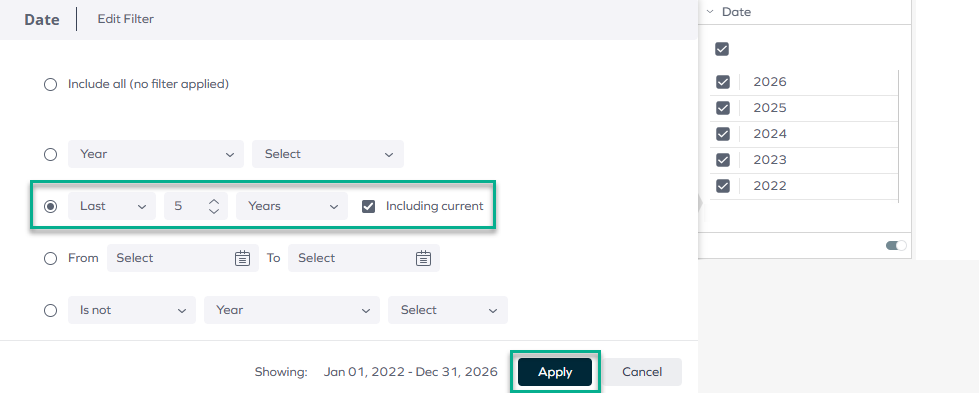
Then, you can select from a variety of options such as containing or not containing specific values, starting or ending with specific values (for instance, the last 5 years including the current year), and more:
You can also disable filtering in a number of ways, for example:
-
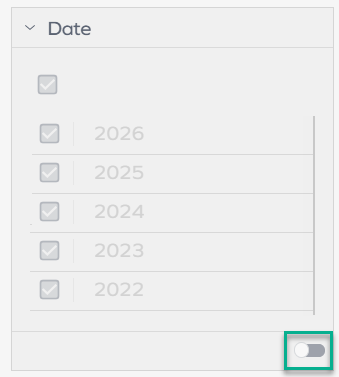
By disabling the toggle.
-
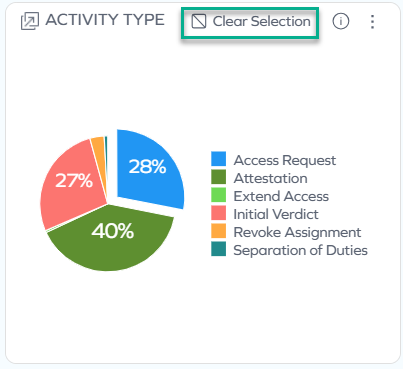
By selecting Clear selection, which appears in the top right corner of a widget when you hover over it.
-
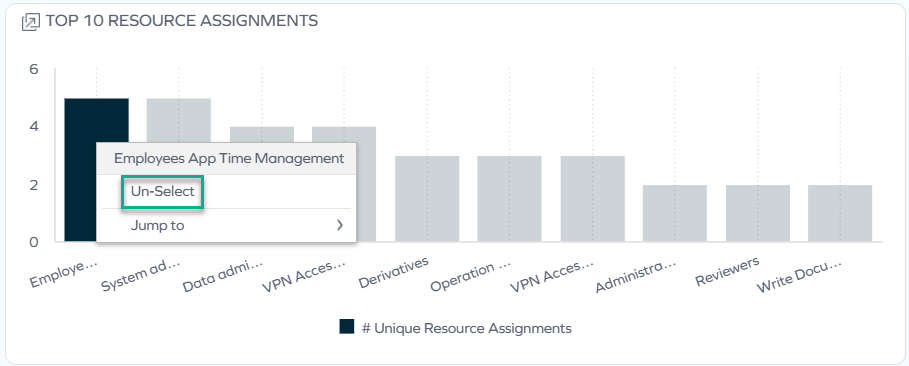
By clicking Unselect next to a widget where you previously selected an item.
-
By resetting filtering in the right pane.
Navigating between jump-to dashboards for detailed investigation
Jump-to dashboards (JTD) are ones that you can jump to from a given widget. Within such dashboards, you can access even more details about resources, identities, approvers, and more. This allows you to investigate access decisions in depth and understand the context around them.
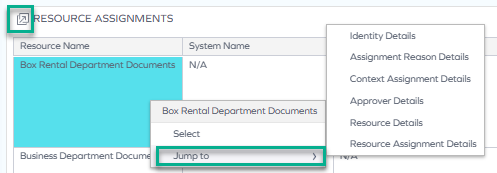
Dashboards and widgets that let you jump to another dashboard can be recognized by an opening icon next to their name.
Right-click an item, hover over Jump to >, and select the dashboard you want to view.
The jumpable widgets include:
-
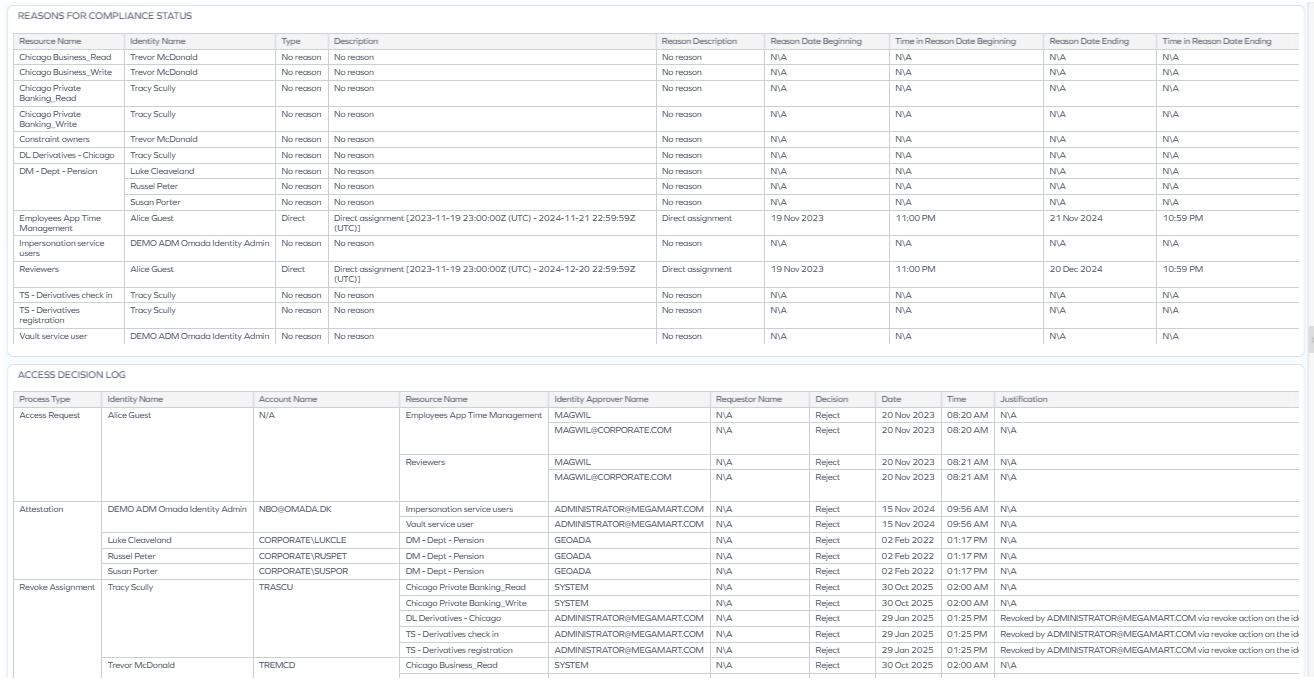
The Decision response pie chart.
It lets you jump to a dashboard displaying the following widgets:
-
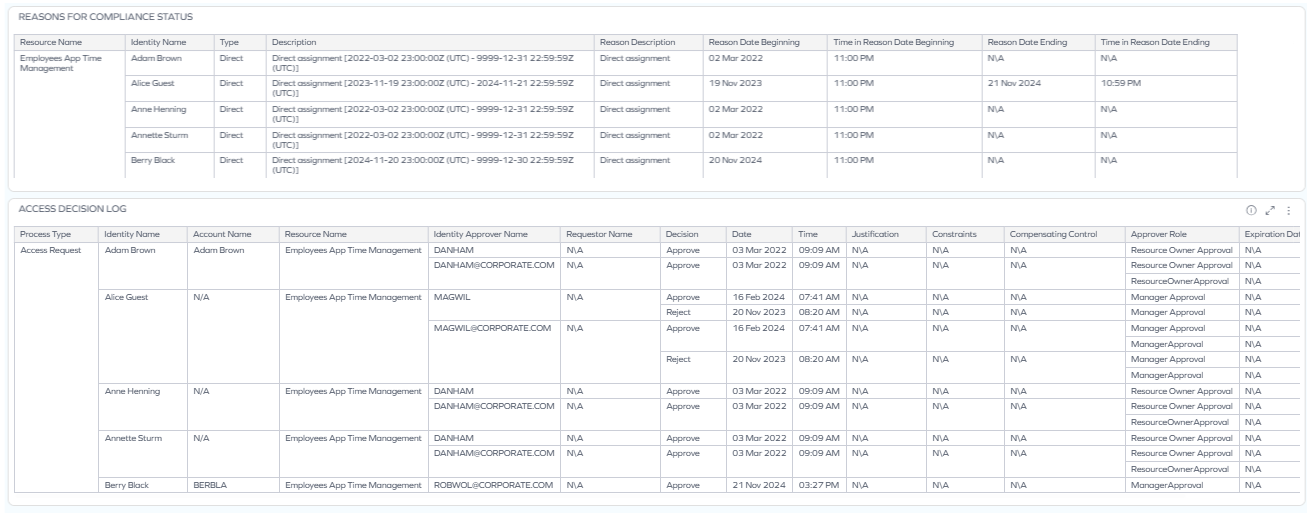
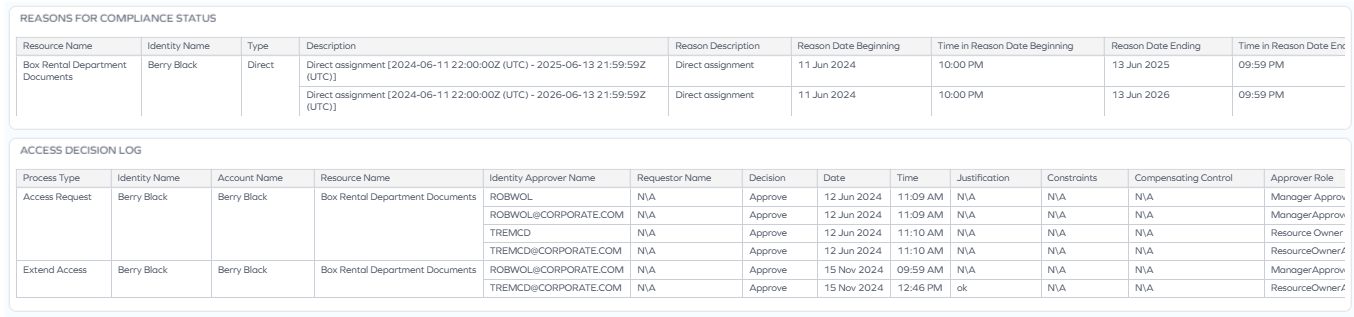
Reasons for compliance status – provides insight into the reasons behind the compliance status of a resource.
-
Access decision log – provides a detailed log of access decisions, including information about the resources, identities, approvers, and more.
-
-
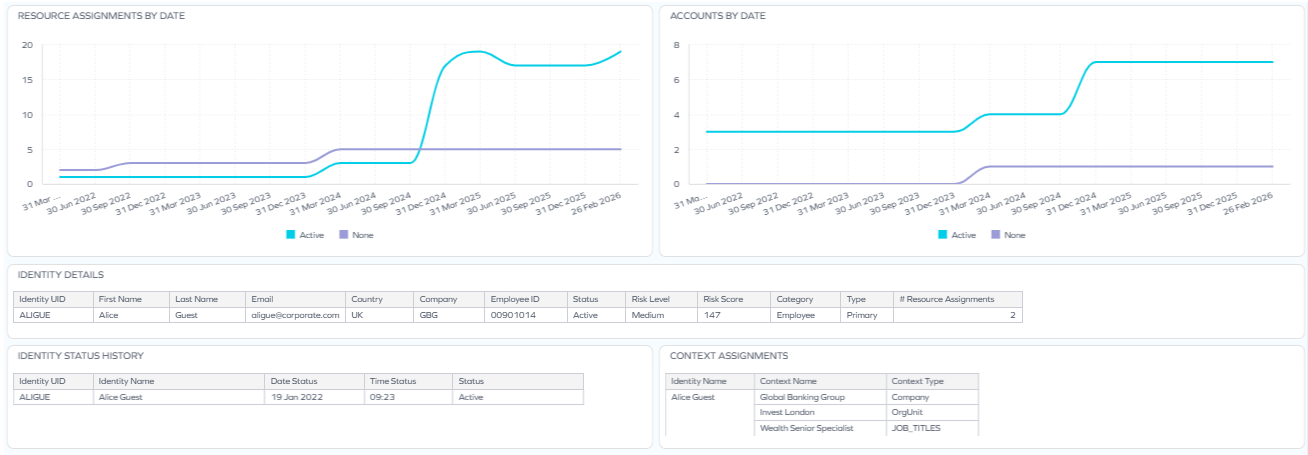
The Activity type pie chart.
It lets you jump to a dashboard displaying the following widgets:
-
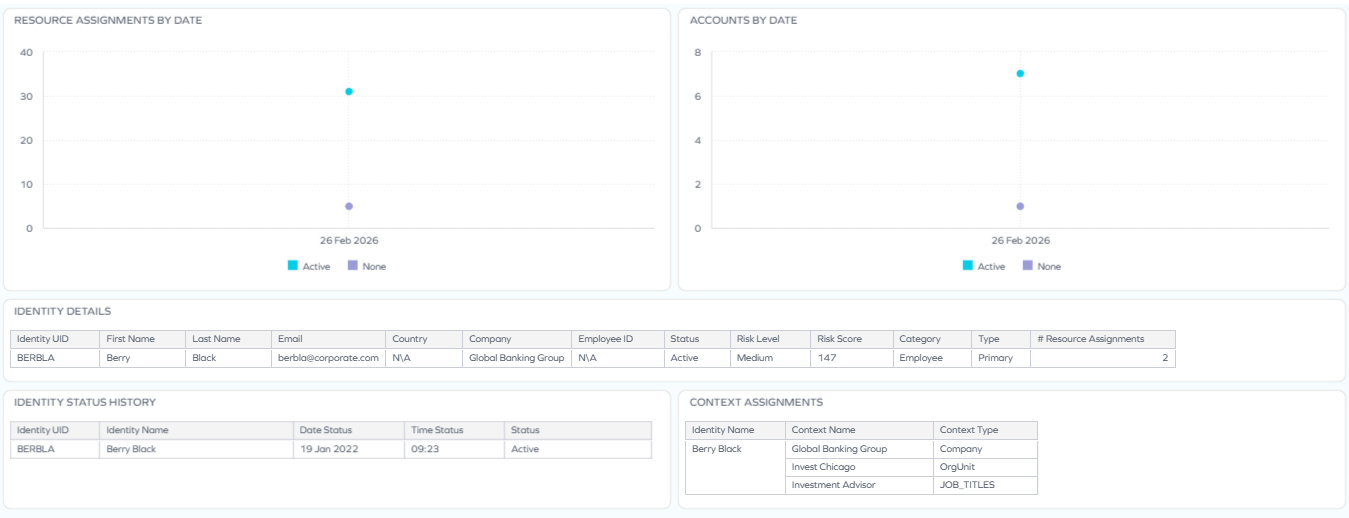
Resource assignments by date – shows the trends of resource assignments over time.
-
Accounts by date – shows the trends of accounts over time.
-
Identity details – provides detailed information about the identities involved in the access decisions.
-
Identity status history – shows the history of changes to the identity status.
-
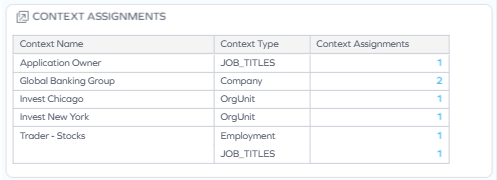
Context assignments – provides information about the context assignments, including the context name, type, and the identities involved.
-
-
The Top 10 resource assignments chart.
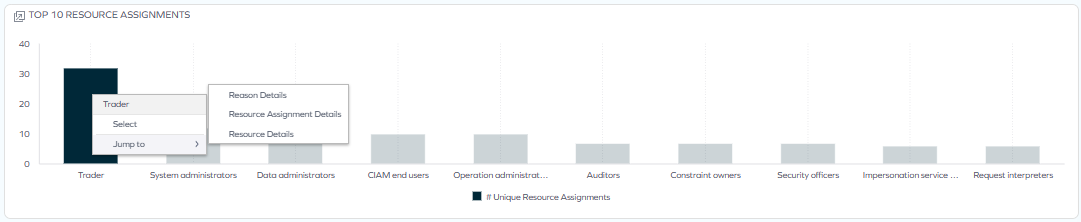
It lets you jump to:
-
Reason details – provides insight into the reasons behind the compliance status and the access decision log.
-
Resource assignment details – provides insight into the resource assignment, such as the validity dates, compliance state, approver name, and more.

-
Resource details – provides detailed information about the resource involved in the access decision, such as its type, category, business description, and more.

-
-
The Resource assignments table.
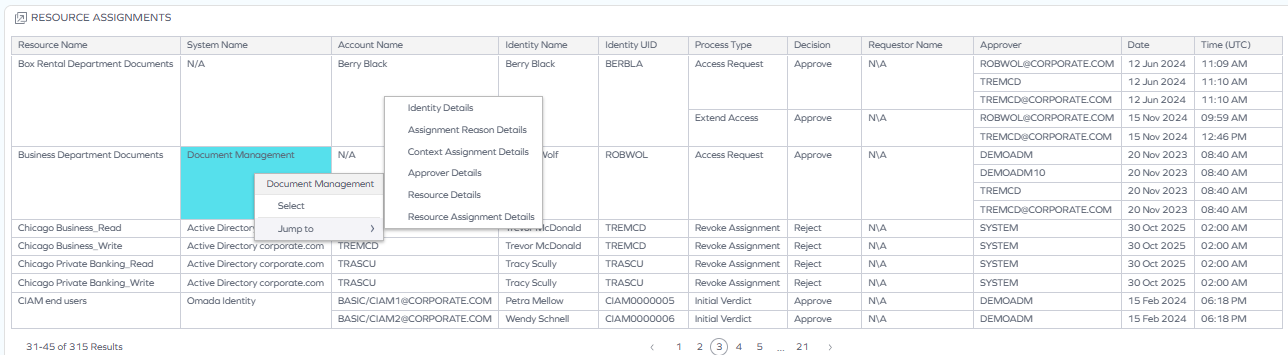
It lets you jump to:
-
Identity details – provides detailed information about the identity involved in the access decision, such as their resource and context assignments, status history, and more.
-
Assignment reason details – provides insight into the reasons behind the assignments, including the reasons for compliance status and the history of changes to these reasons.
-
Context assignment details – provides information about the context assignments, including the context name, type, and the assignments themselves.
-
Approver details – provides details about the approver involved in the access decision, such as their personal and contact information, their role in the organization, risk, and more.

-
Resource details – provides detailed information about the resource involved in the access decision, such as its type, category, business description, and more.
-
Resource assignment details – provides insight into the resource assignment, such as the validity dates, compliance state, approver name, and more.
-
Exporting data
To export (download) the content of any widget, open the three-dots menu next to it, select Download, and choose a format.
Before you download the content of a widget, read Omada Identity Analytics – Downloading and exporting for details on the available formats as well as their limitations.
Example use cases
This dashboard can be used for a variety of auditing and reporting purposes. The table below outlines examples of key use cases by role:
| Role | Use cases |
|---|---|
| Auditors |
|
| Managers |
|
| System owners |
|
Data model
The data displayed on OIA dashboards reflects the state of the last successful build, which occurs every day after midnight; it is not streamed live. For more information, see the introduction to dashboards: Omada Identity Analytics – Data model.