IGA Scorecard
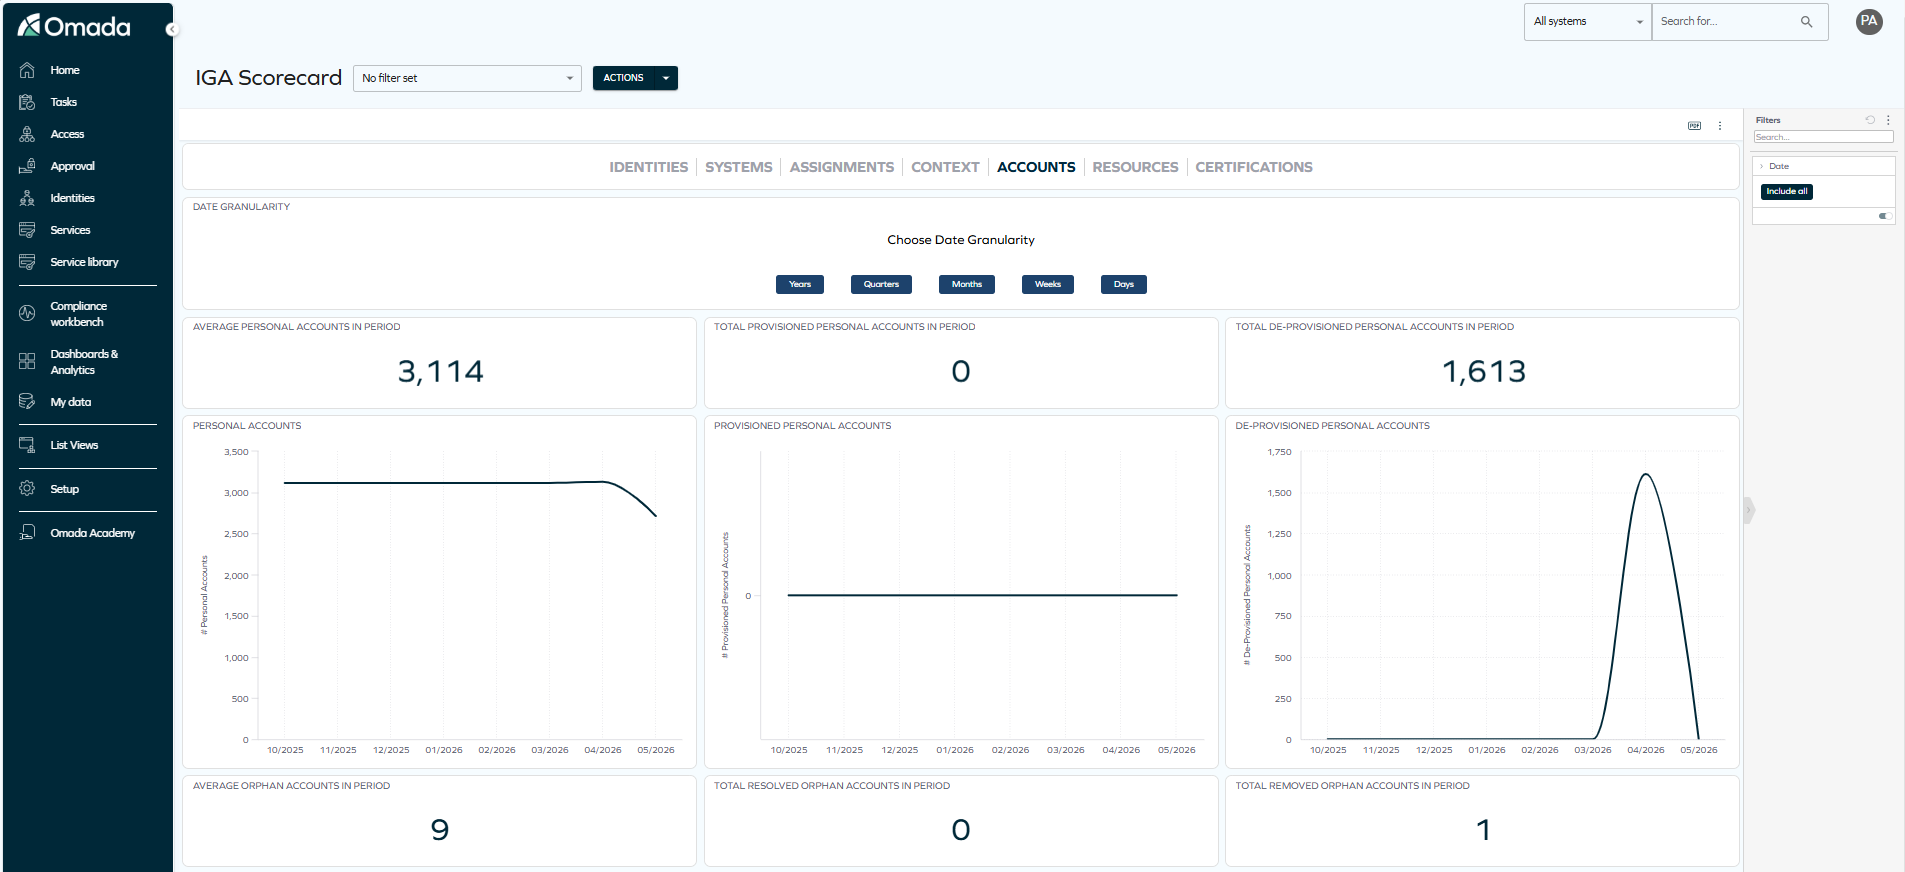
The IGA Scorecard dashboard offers a high-level overview of identity governance activity from a variety of points of view: identities, systems, assignments, contexts, accounts, resources, and certifications.
Overview
With flexible date granularity (from years down to days), this dashboard highlights trends such as the average number of active identities, onboarded and offboarded identities, and system counts over time. This scorecard view helps organizations monitor key metrics at scale and spot changes in their IGA landscape with clarity.
Tabs
The dashboard is organized into seven tabs, each focusing on a specific aspect of identity governance:
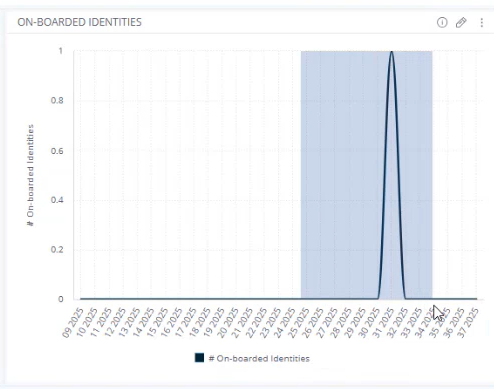
- Identities – Tracks trends in active, onboarded, and offboarded identities over the selected period.
- Systems – Monitors the number of systems and changes in system counts over time.
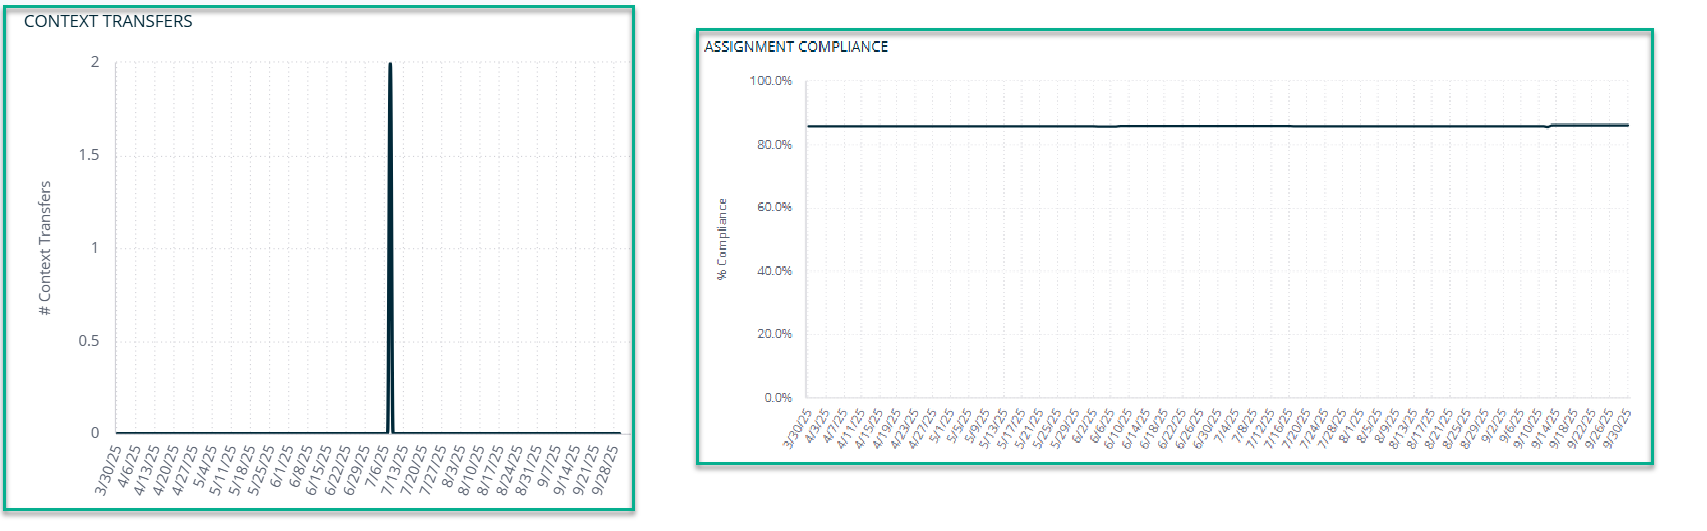
- Assignments – Provides an overview of assignment counts and compliance trends.
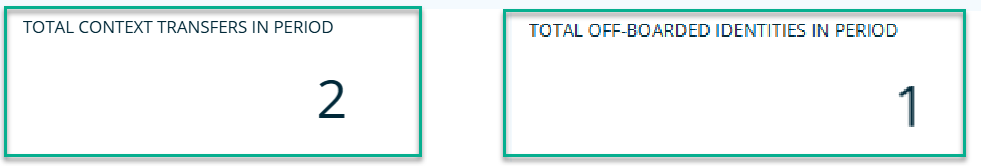
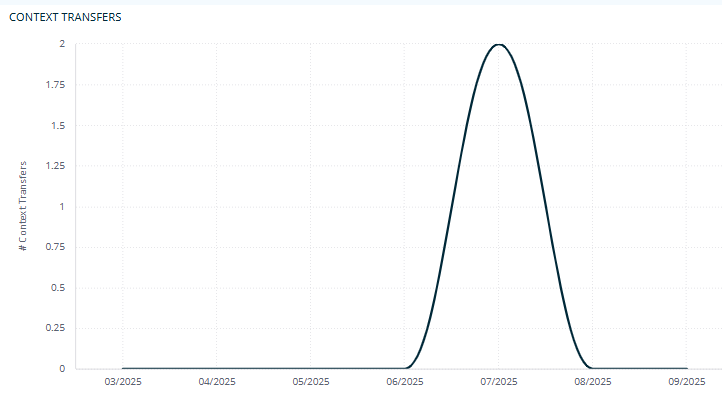
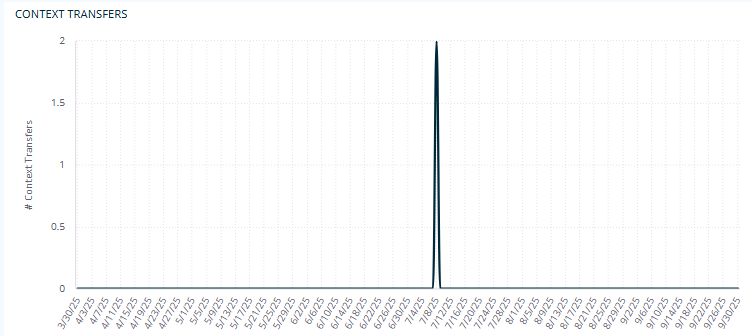
- Context – Tracks context transfers and context-related identity activity.
- Accounts – Shows account counts and changes, including orphaned or unlinked accounts.
- Resources – Covers resource assignment trends and resource-level activity.
- Certifications – Summarizes certification activity, including completed and pending certifications.
The tabs give you a comprehensive view of your IGA landscape, allowing you to analyze trends and identify areas that may require attention or improvement.
You can switch between tabs to explore different facets of your access data and gain insights into how various components are performing over time, thanks to a variety of widgets and date granularity options.
Widgets
On each tab, you will find two types of widgets:
-
Widgets that display KPI numbers for the selected period. For example, on the Identities tab, you can see:
- Average active identities in period
- Total onboarded identities in period
- Total offboarded identities in period
-
Widgets that display trend charts over time. For example, on the Identities tab, you can see:
- Active identities
- Onboarded identities
- Offboarded identities
Use the widgets to monitor trends and identify changes in your IGA landscape.
For example, if you notice a drop in the percentage of compliant assignments on the Assignments tab, you can take action to investigate and address the issue.
Filtering options
Date granularity
By selecting years, quarters, months, weeks, or days, you can choose how you want to view the data on the widgets below.
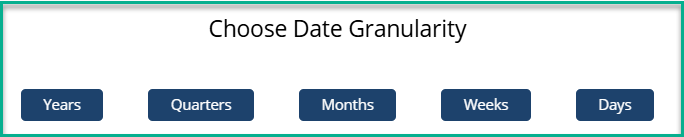
For example, if you select Months, data is immediately sorted by months.
Then, if you switch to Days, the data is immediately reorganized by days.
The filtering applied on one tab is reflected on each tab that you move to. For example, if you choose to view data sorted by weeks while viewing the Identities tab, you will also see data from the last week on the next tabs.'
To change it, select a different date granularity or use the filter pane to select a specific date or date range.
Narrowing down the date granularity
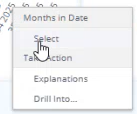
On each chart, the displayed dates can be narrowed down to the dates of your choice: for example, to a few particular weeks or days. You can click and select the date range manually.
Then, a menu appears. If you click Select, the data is immediately reorganized to only reflect the dates of your choice.
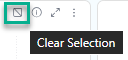
To clear the date selection and return to the previous view, you have 2 options:
- Click the erasing icon next to the date range.
- Use the filter pane to select a different date or to restore the previous view.
Filter pane
You can also select any dates by using the filter pane on the right-hand side. To do this:
-
Click Include all to open the filtering options.
-
Choose the dates of interest to you.
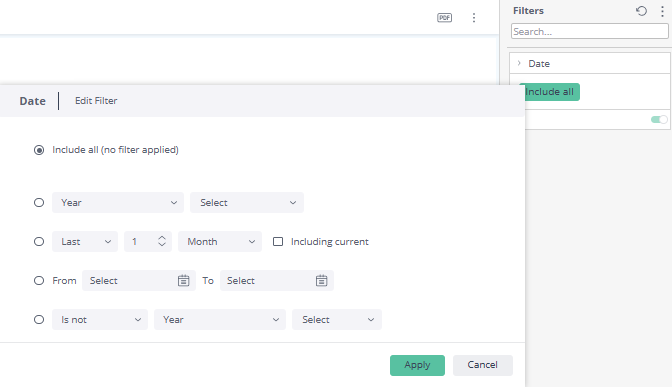
noteThe pane gives you a variety of filtering options, including:
- All dates (no filter applied).
- Selecting a specific year, quarter, month, and smaller time units.
- Selecting a relative date range with options such as the current, last, or next year(s), quarter(s), month(s), and smaller time units, with the option of including the current date or not (for example, the last 5 years including this year).
- Selecting a custom date range with the options from and to (for example, from January 1, 2023, to June 30, 2023).
- Selecting a relative date range with the options last and next (for example, the last 7 days or the next 3 months).
- Applying a custom selection including or excluding a particular date or range of dates (for example, the last year with the exclusion of the last month).
-
Click Apply.
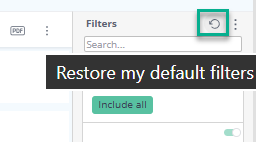
To clear filters and start over, select the refreshing icon at the top of the filter pane.
Downloading and exporting
To export (download) the content of any widget, open the ellipsis menu next to it, select Download, and choose a format.
Before you download the content of a widget, read Omada Identity Analytics – Downloading and exporting for details on the available formats as well as their limitations.
Data model
The data displayed on OIA dashboards reflects the state of the last successful build, which occurs every day after midnight; it is not streamed live. For more information, see the introduction to dashboards: Omada Identity Analytics – Data model.
Example use case
The IGA Scorecard dashboard is ideal for monitoring key metrics at scale and spotting changes in your IGA landscape with clarity. For example, you can use it to track the average number of active identities over time, identify trends in identity lifecycle events, and monitor system counts.
This high-level overview allows you to quickly identify areas that may require attention or improvement, such as a sudden drop in compliant assignments or an unexpected increase in orphan accounts.
By regularly reviewing the IGA Scorecard, you can stay informed about the overall health of your identity governance and make data-driven decisions to enhance security and compliance.