IGA Scorecard
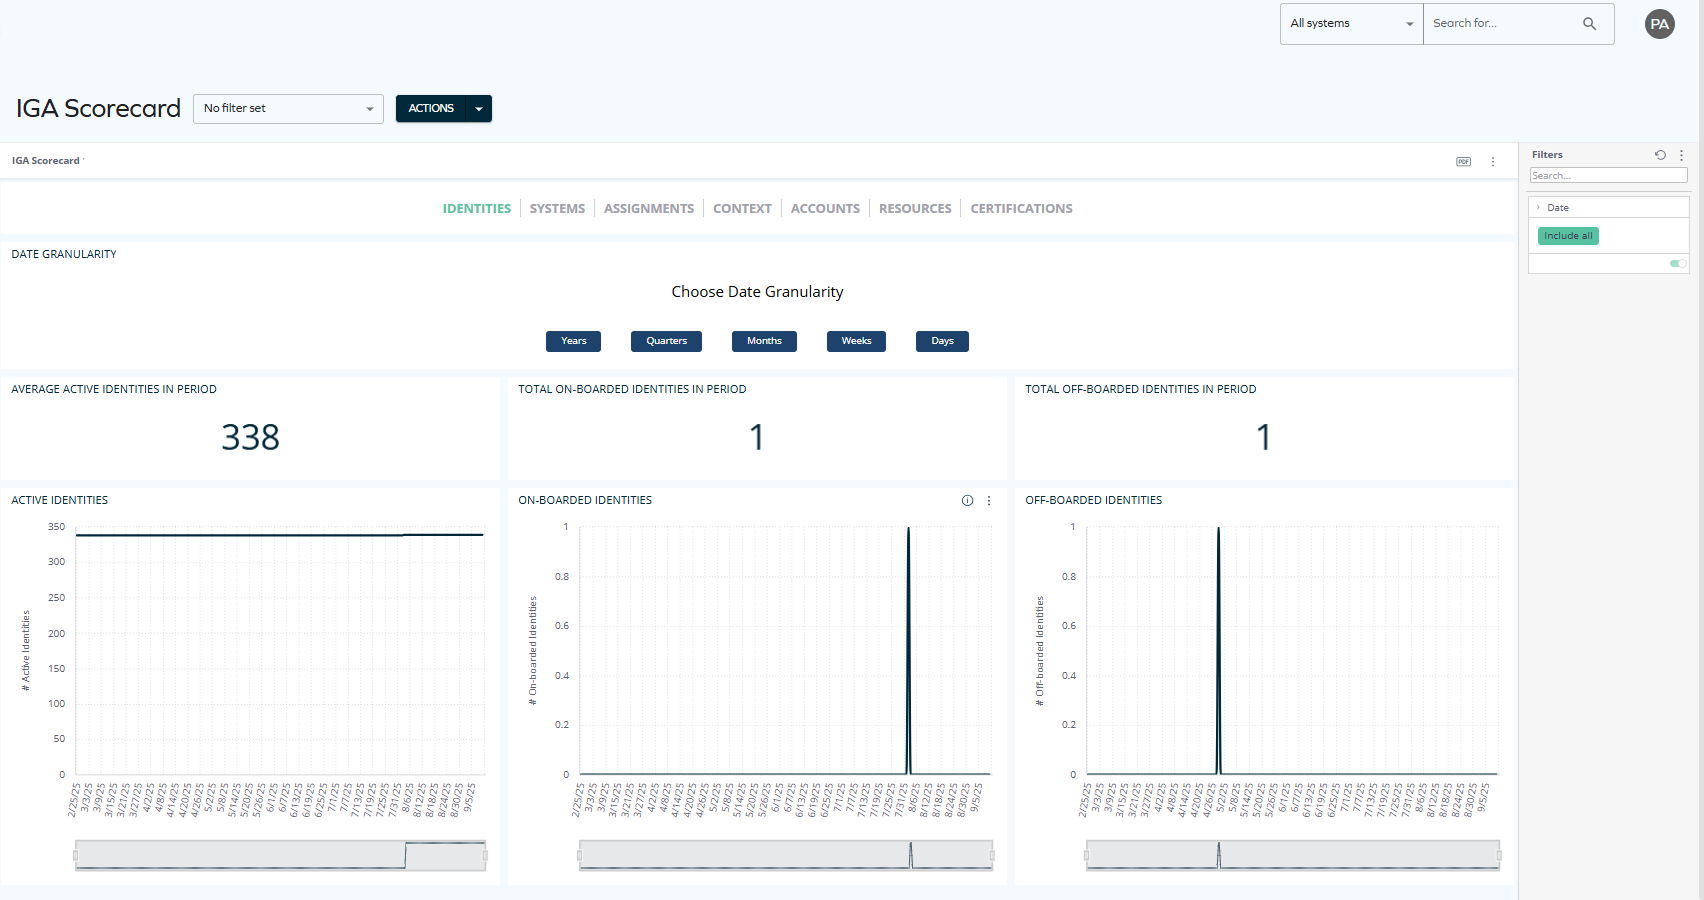
The IGA Scorecard dashboard offers a high-level overview of identity governance activity from a variety of points of view: identities, systems, assignments, contexts, accounts, resources, and certifications.
In Q1 2026, the Omada Identity Analytics dashboards will be visually updated to match Omada's current branding, including colors and typography. The following screenshot reflects the updated look.
Updates to individual screenshots throughout the documentation will be applied incrementally in subsequent updates.
The data displayed on OIA dashboards reflects the state of the last successful build, which occurs every day after midnight; it is not streamed live. For more information, see the introduction to dashboards: Omada Identity Analytics – Data model.
Overview
With flexible date granularity (from years down to days), this dashboard highlights trends such as the average number of active identities, onboarded and offboarded identities, and system counts over time. This scorecard view helps organizations monitor key metrics at scale and spot changes in their IGA landscape with clarity.
Widgets
On each tab, you will find a number of insightul widgets.
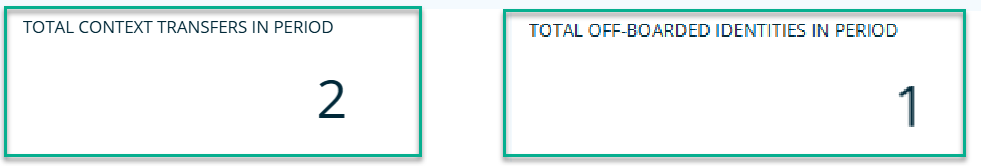
The top widgets display numbers (for example, the total number of context transfers in the selected period, or the number of offboarded identities in the selected period):
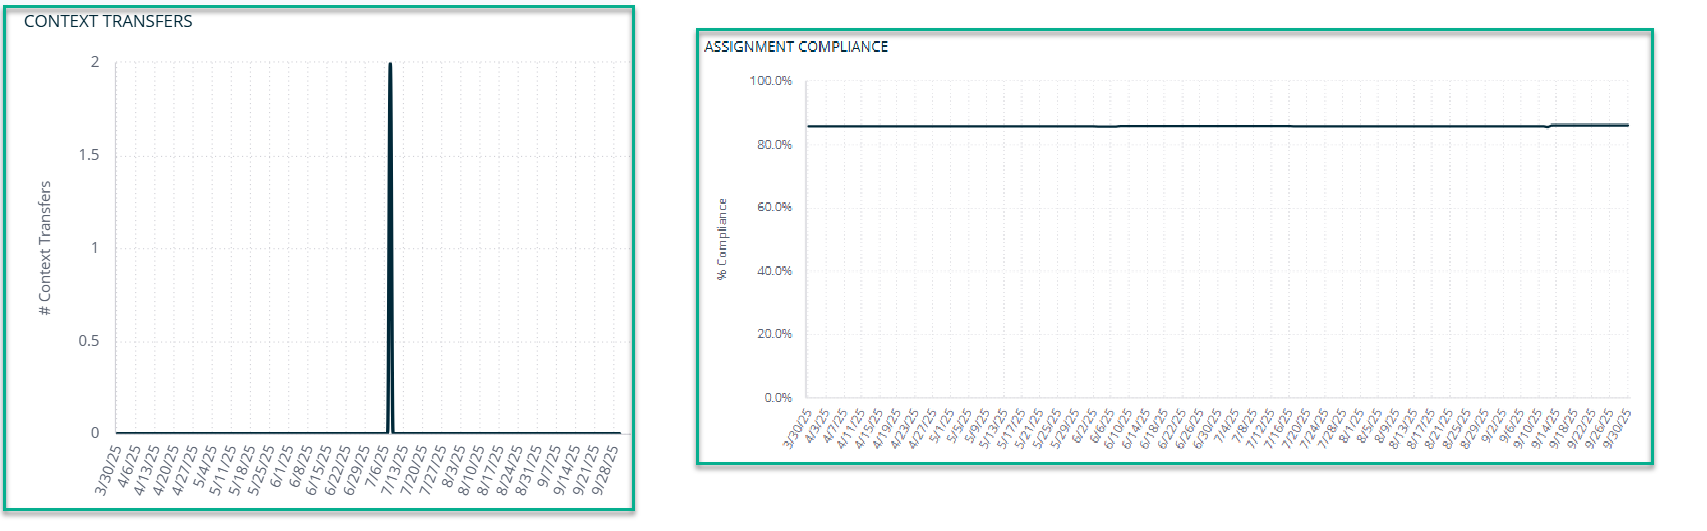
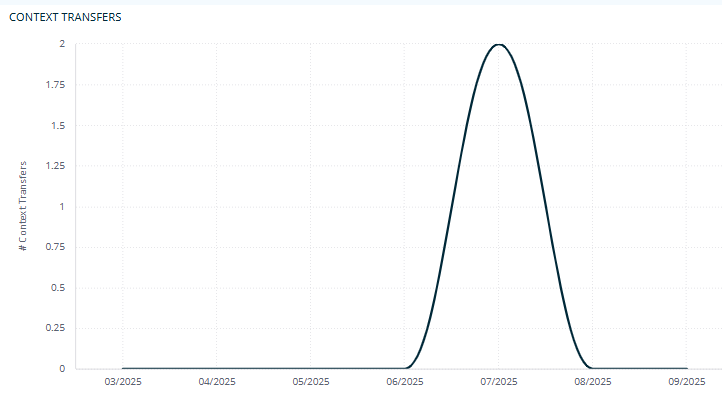
The widgets at the bottom display charts (for instance, with the number of context transfers or the percentage of assignment compliance):
Date granularity
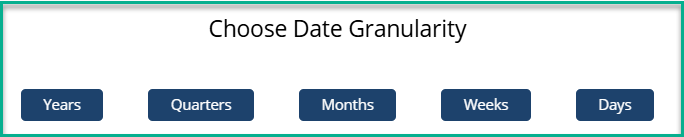
By selecting years, quarters, months, weeks or days, you can choose how you want to view the data on the widgets below. For example, if you select Months, data is immediately sorted by months:
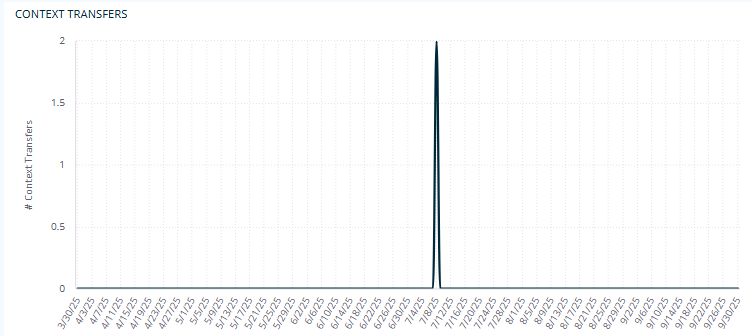
Then, for example, if you select Days, the data is immediately reorganized by days:
The filtering applied on one tab is reflected on each tab that you move to. For example, if you choose to view data sorted by weeks while viewing the Identities tab, you will also see data from the last week on the next tabs.
Narrowing down the date granularity
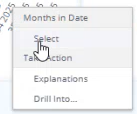
On each chart, the displayed dates can be narrowed down to the dates of your choice: for example, to a few particular weeks or days. You can click and select the date range manually:
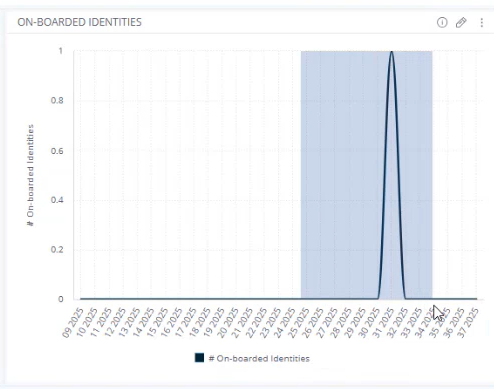
Then, a menu appears. If you click Select, the data is immediately reorganized to only reflect the dates of your choice.
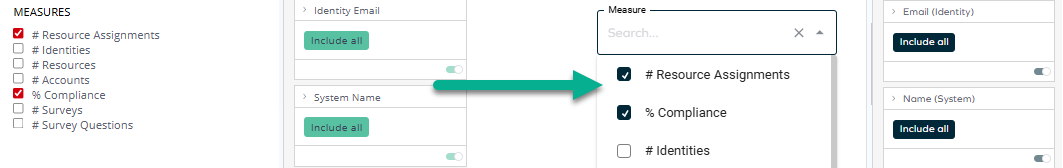
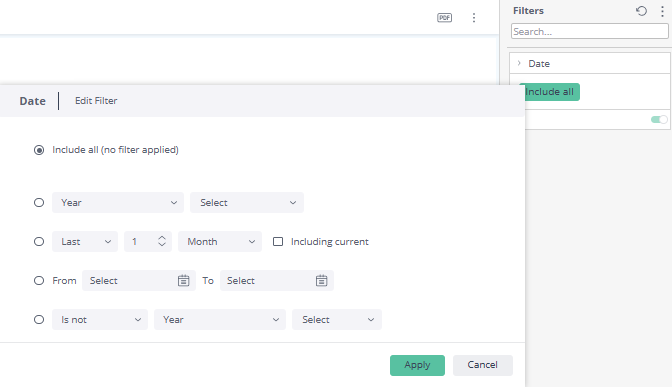
Filter pane
You can also select any dates by using the filter pane on the right-hand side. Click Include all and choose the date of interest to you. The data will get rearranged immediately on every widget, on each tab.
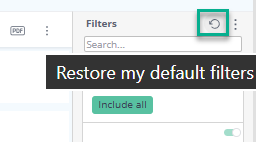
To clear filters and start over, select the arrow next to the filter:
Downloading and exporting
Before you download the content of a widget, read Omada Identity Analytics – Downloading and exporting for details on the available formats as well as their limitations.
To export (download) the content of any widget, open the three-dots menu next to it, select Download, and choose a format.