Report Generator
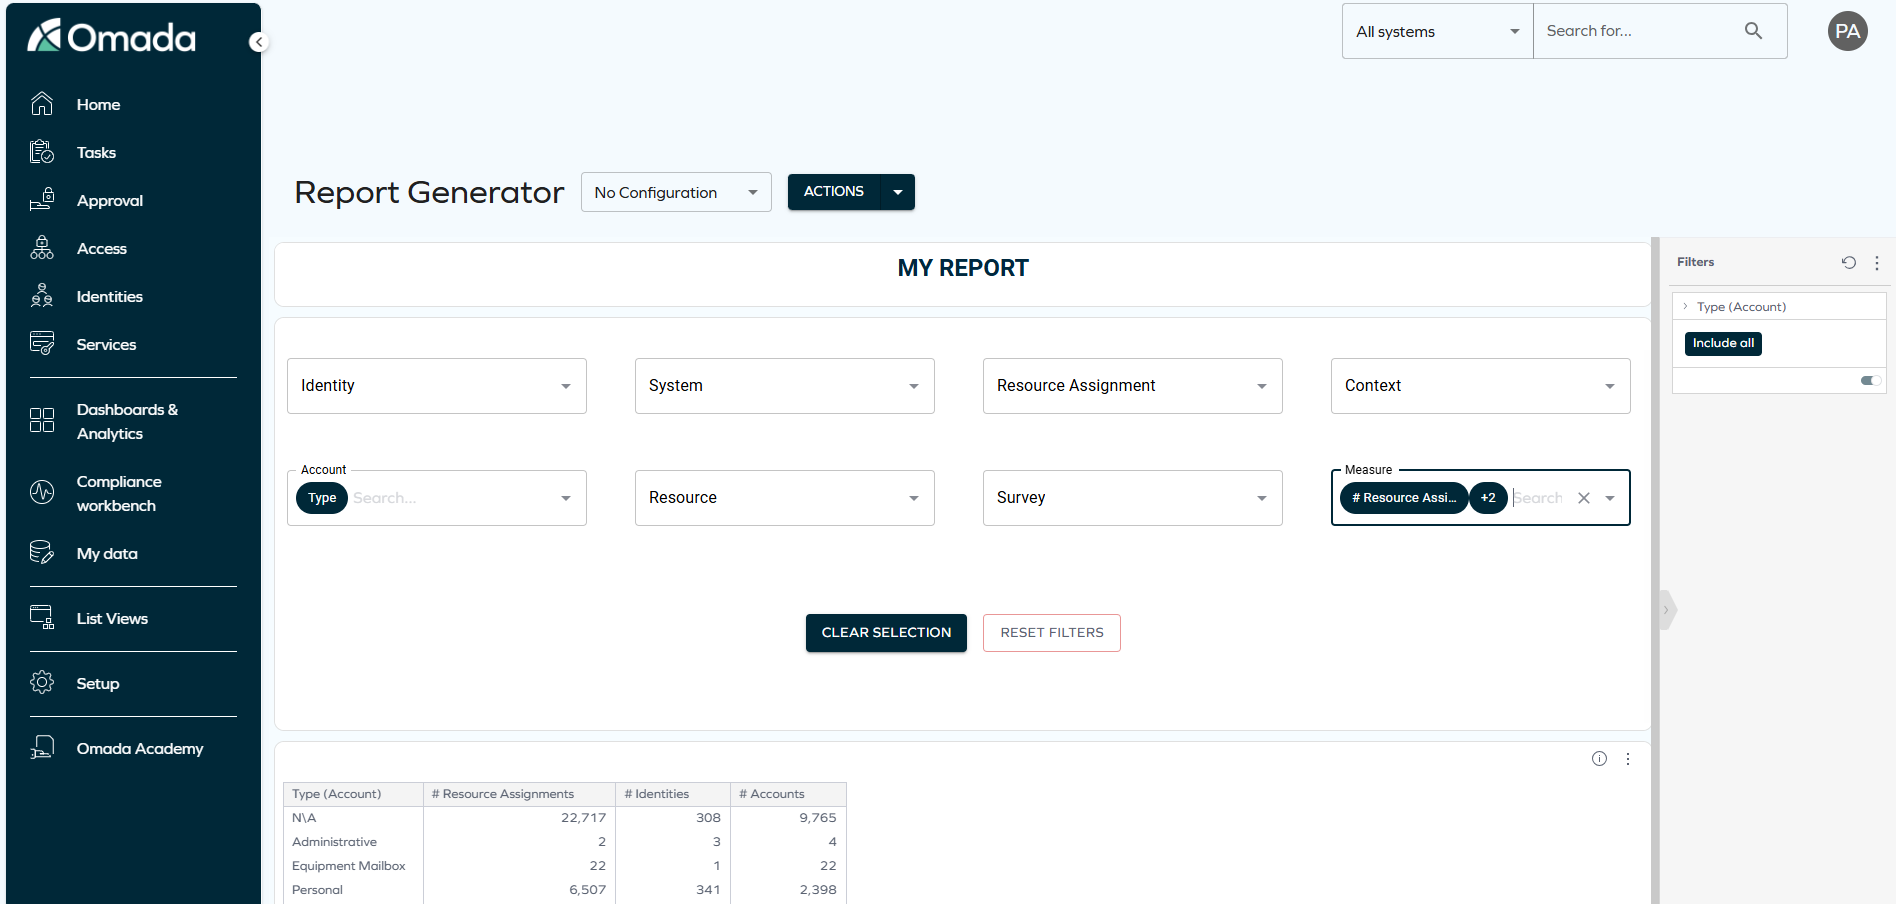
The Report Generator dashboard lets you build custom reports by selecting attributes from predefined categories and applying optional filters. It provides a flexible way to analyze access-related data in a scope tailored to your needs.
The data displayed on OIA dashboards reflects the state of the last successful build, which occurs every day after midnight; it is not streamed live. For more information, see the introduction to dashboards: Omada Identity Analytics – Data model.
Overview
The Report Generator consists of:
- Dropdown lists, where you select the data fields to include in the report, for example, Identity, Context, or Measure.
- Filters on the right pane, which narrow down the data shown in the report.
- Your generated report, which appears at the bottom, displaying the results based on your selections.
Generating a report
To generate a report, define its structure by selecting and applying items from the dropdown lists (or dropdowns, for short). The available categories, as well as the items inside them, include:
-
Identity (with numerous items such as identity name, risk level, manager name, and more)
-
System (with system name and classification)
-
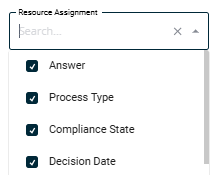
Resource assignment (with attributes that describe the lifecycle, approval context, and compliance state of individual resource assignments)
noteThese attributes include:
-
Audit trail-related items: Answer, Process type, Compliance state, and Decision date, which capture whether access was approved or rejected, how the decision was made (for example, request-based approval or attestation), and when the decision occurred.
While all attributes are scoped to resource assignments, these four decision-related attributes are also commonly used for audit and review reporting, as they reflect approval and attestation outcomes that would otherwise be found in audit trail views.
-
Other resource assignment-related items: Resource assignment start date and Resource assignment expiration date, which show the validity period of the assignment, as well as Resource assignment reason type, which explains why the assignment exists.
-
-
Context (with context name, type, and owner name)
-
Account (with account name and login as well as last login information)
-
Resource (with resource name, classification, category, type, and risk level)
-
Survey (with survey name, starting date, as well as questions and their status)
-
Measure (with the total number of identities, resources, resource assignments, accounts, surveys, and survey questions, as well as the compliance score)
Understanding dropdowns
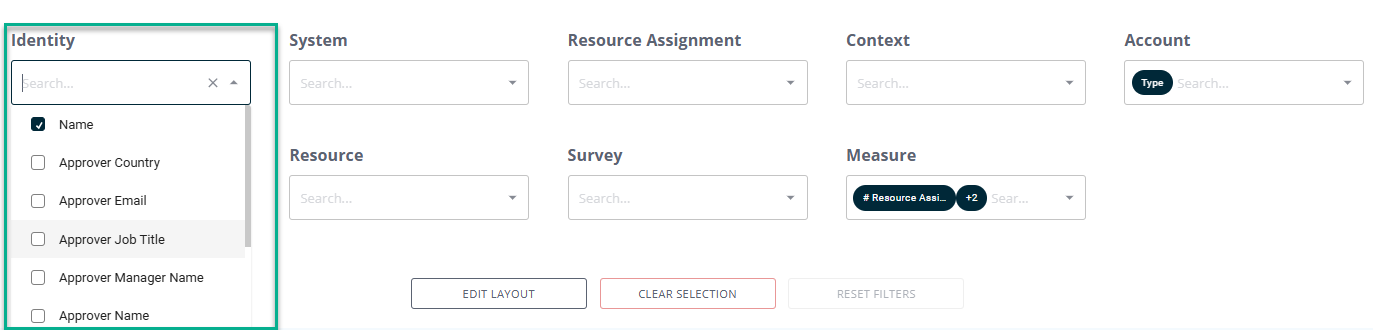
When you open a dropdown list:
-
The list shows all available attributes for that category, ordered alphabetically.
-
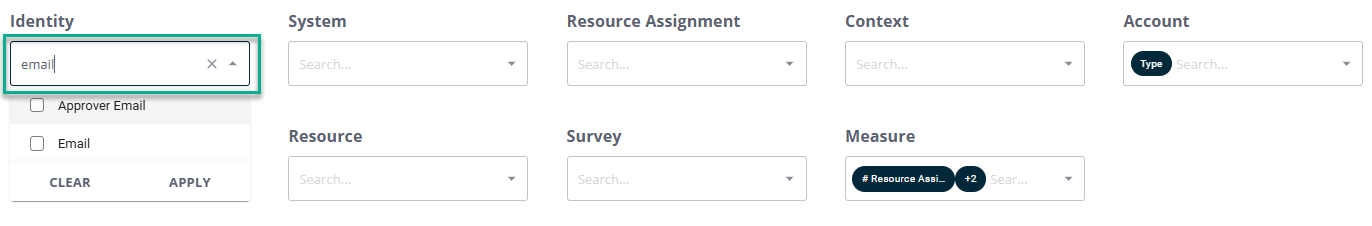
You can search within the dropdown by typing; the input field acts as an autocomplete search.
-
Attributes configured specifically for your environment (extension attributes) can also appear on the list:
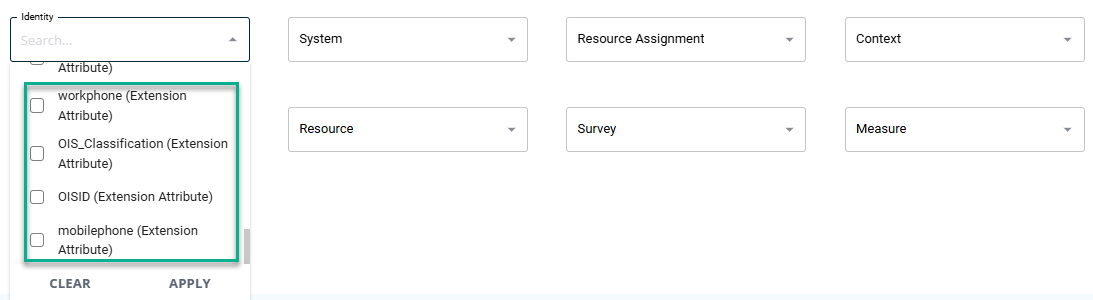 info
infoThe maximum number of extension attributes that can be configured for each field is limited:
Attribute Upper limit of extension attributes displayed Account 40 Context 20 Identity 40 Resource 10 System 5 If the number of configured extension attributes exceeds the supported limit, the dropdown displays only the maximum allowed number for each field, ordered alphabetically.
See Managing extension attributes to learn how to create and manage extension attributes.
Selecting and applying attributes to generate a report
To select attributes:
-
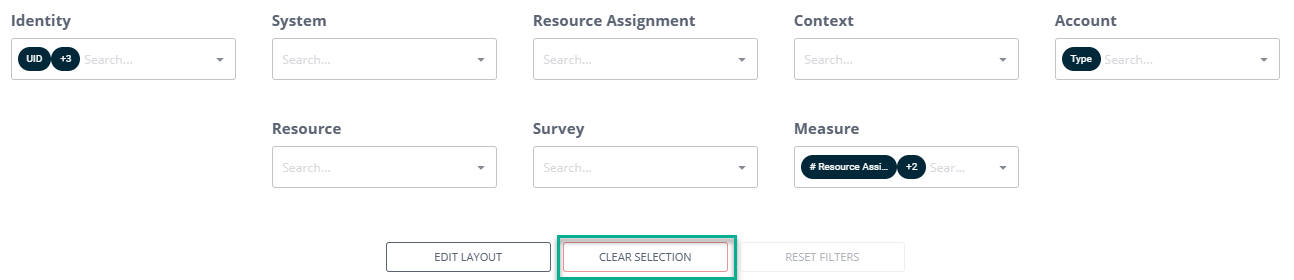
Open a dropdown (for example, Identity, as in the previous screenshots).
-
Select one or more attributes by checking the boxes. (For selected items, the checkboxes are shown as dark blue.)
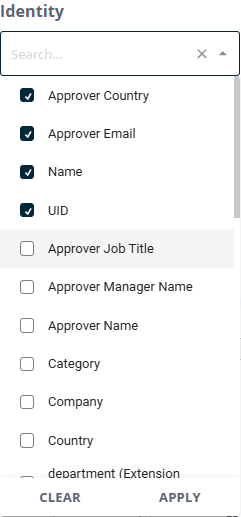 warning
If you close the dropdown at this point (without applying, as in step 3), you will get a warning saying that not all your changes have been applied.

-
Click Apply to add the selected attributes to the report. (After applying, the checkboxes turn green.)
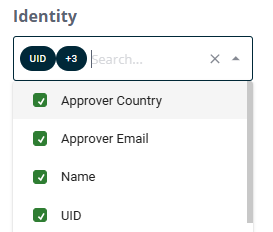
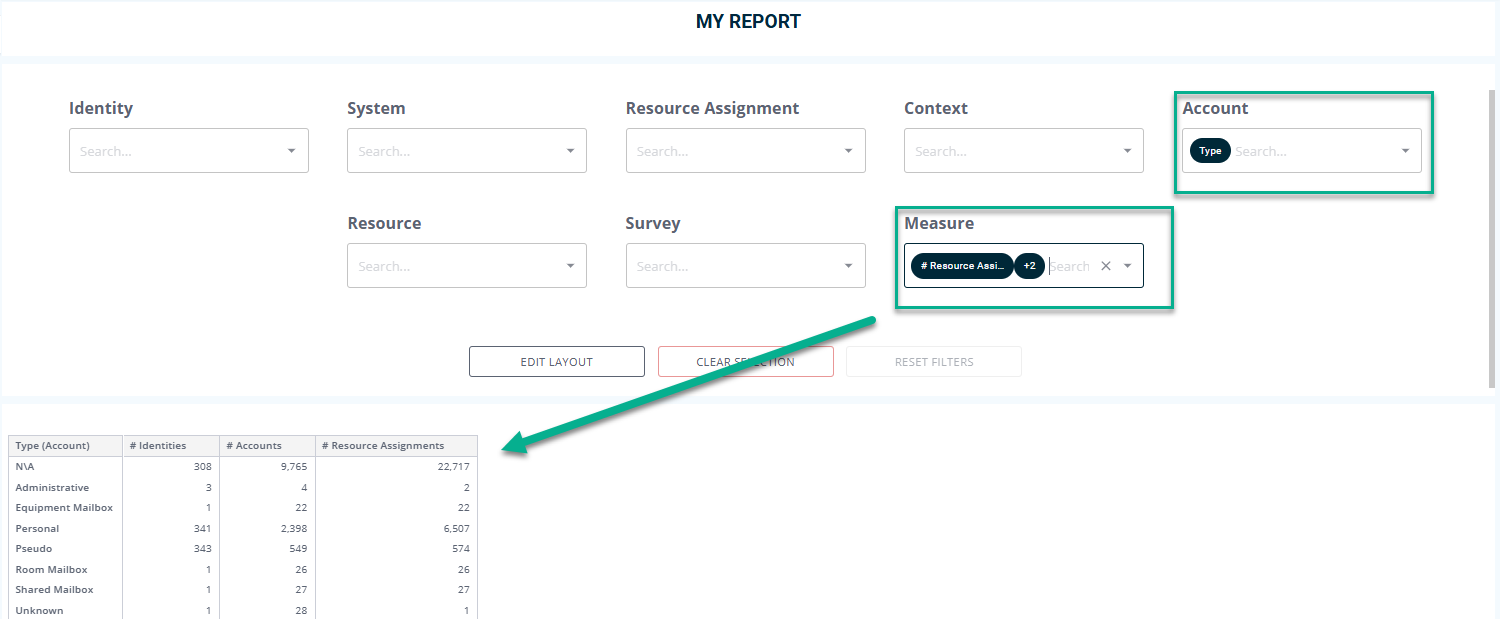
While you apply items from the dropdown lists, they automatically appear in the report below.
 note
note-
Each attribute selected by you becomes a column in your report and is automatically populated with data.
-
The table updates dynamically as you apply or remove attributes, change measures, and enable or disable filters.
-
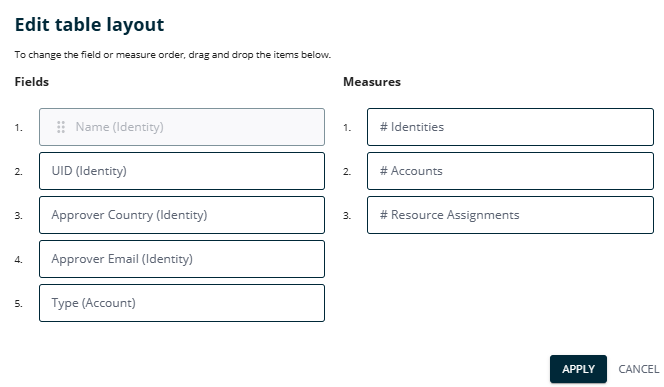
The columns appear in the report in the same order as you selected items from the dropdown lists. To reorder the columns in your report, click Edit layout to drag and drop the columns in the desired order. Apply your changes.
-
To undo your selection and start again, click Clear selection.
-
Filtering
Apart from using dropdowns, you can also apply additional filters to your data to tailor the scope to your needs.
-
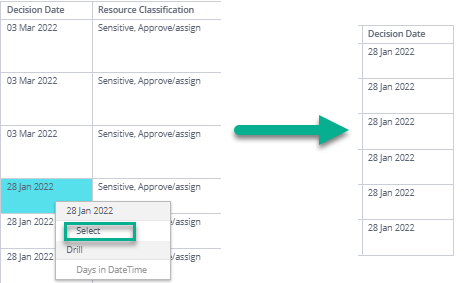
You can right-click on an item in the table and click Select. The table immediately gets rearranged according to your filtering: for example, it is now filtered by a particular decision date.
-
When you apply items from the dropdowns, filters reflecting this selection appear on the right pane.
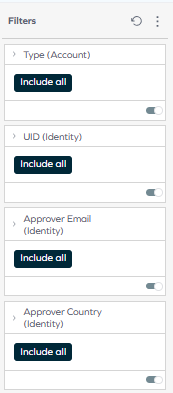
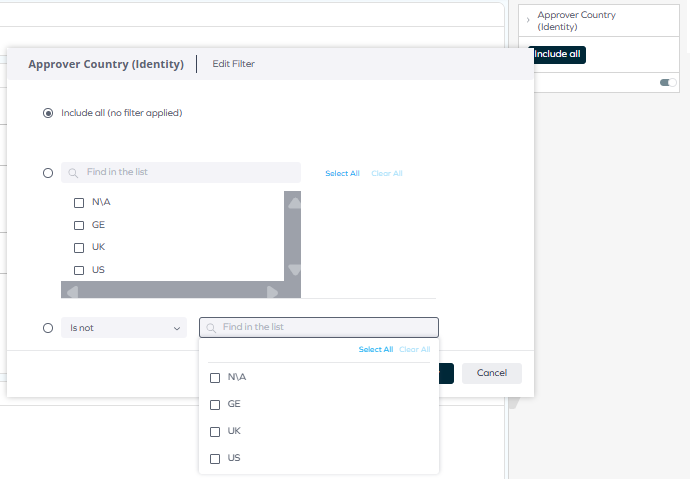
By default, the filters are set to Include all, meaning that all items matching the filters will be shown. To change this scope, click Include all, then select the parameters to filter by. For example, you can select particular identities or exclude them. There is a variety of parameters, such as Is not, Contains, or Is not empty, allowing you to explore data from different angles.
-
Combining filters: You can filter by several items at once: for instance, if you want to view who approved the access to particular resources in one particular department, you can select that department, narrow down to those resources, and filter by approvers.
-
Automatically updated filtering: Filtering options automatically complement each other: if you select an item with the right-pane filters, they are immediately applied in your report, and if you select an item inside your report, it also appears on the right pane.
Disabling filters
After using any filtering option, you can reset or disable it:
-
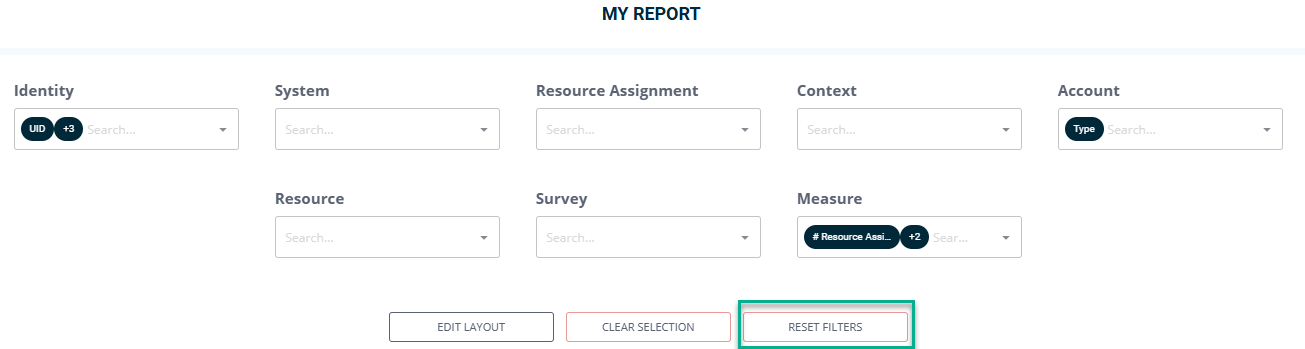
By selecting Reset filters under the dropdown lists. This resets the filtering, meaning that all filters are switched to Include all and are not focused on any particular item (for example, one identity or context that you selected).
-
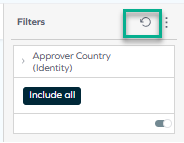
By clicking the refresh icon at the top of the right filter pane. This removes all the filters applied from the right pane.
-
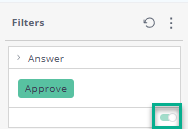
By disabling the toggle next to a particular filter. This disables one filter only.
Downloading your report
To export (download) the content of your report, open the ellipsis menu next to it, hover over Download, and choose a format.
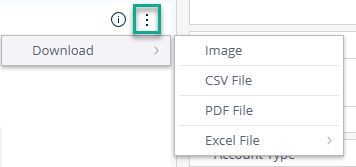
-
The most standard and flexible format for downloading your report is CSV: it guarantees that your data will be displayed with no limitations to the width or length of the report. Additionally, after opening your CSV report in a spreadsheet, you can save it in different formats.
-
Before you download your report from the Report Generator in other formats, read Omada Identity Analytics – Downloading and exporting for details on the available formats as well as their limitations.
Managing your configuration for future use
At the top of the Report Generator, the Actions menu provides options for managing report configurations in case you want to reuse them or share them with another user.

Save configuration
You can save all the selected items and filters applied to your report. When you click Save configuration, a window appears where you can type the name of your custom configuration and make it private or public. You will later be able to reuse it or share it with other users.

Update configuration
To modify a previously saved configuration, select an existing configuration, check or uncheck some additional checkboxes, and click Update configuration. You will be asked to confirm this operation.

Delete configuration
While a configuration is applied, you can choose to delete it. Then, it immediately disappears from the Report Generator, and you can see that No configuration is applied:

Share configuration
You can get a link to share your saved configuration. When you click Share configuration, a message appears at the lower-right corner of your screen, confirming that the link has been copied to your clipboard.

Then, another user can use this link to open the Report Generator with your configuration.
While using the link to your saved configuration, other users will only see the data that they have access to.
Export configuration
By clicking Export configuration, you can save the applied configuration on your device as a JSON file.
Import configuration
You can import a JSON file with a previously saved configuration: when you click Import configuration, a window appears, and you can select the file from your device.
Access to this dashboard
To learn which user groups have access to this dashboard, see Access to dashboards.