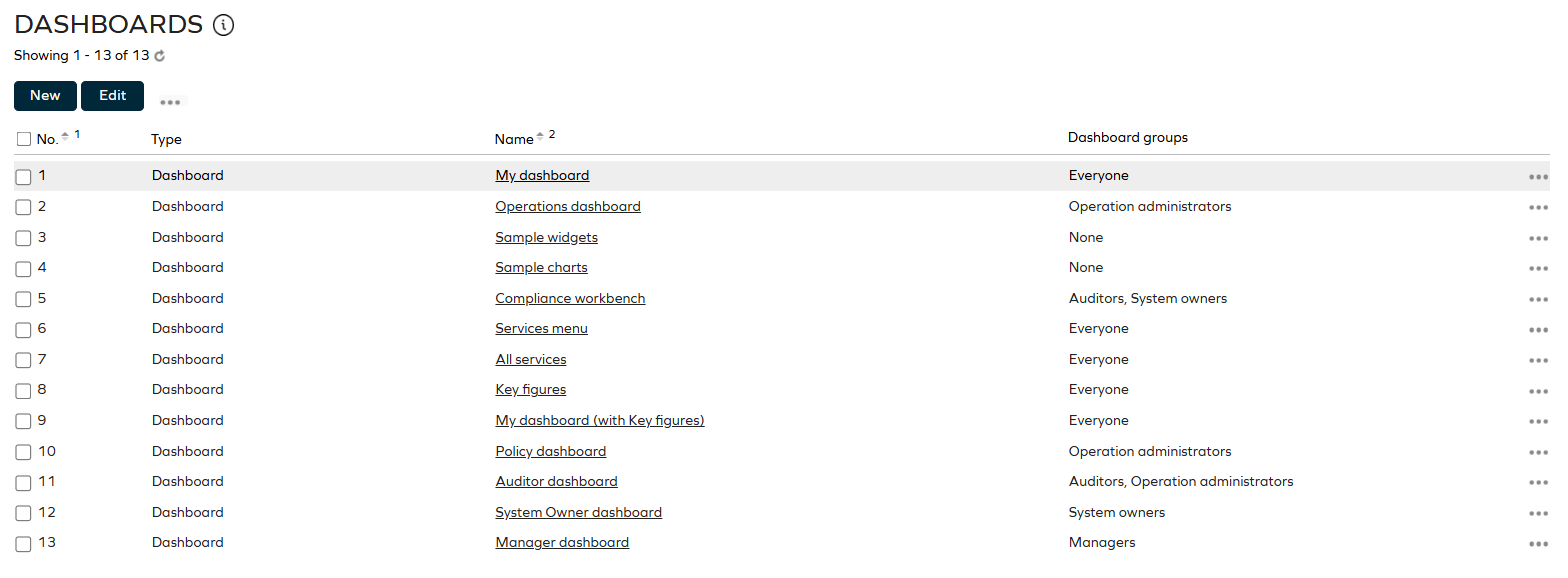
Dashboards
When you open the Omada Identity portal, the first screen you see is the home page dashboard, regardless of your permissions. However, depending on the permissions, there may be differences in the content shown on the dashboard.
Omada Identity comes with two standard dashboards:
-
The Operations dashboard that is available to System Administrators and Operations Administrators (and is further described in the Operations Dashboard section below).
-
The default dashboard that is available to all users.
The default dashboard page automatically shows the dashboard that the active user is allowed to use. This is an example of the default dashboard for a regular user without any administrative rights:
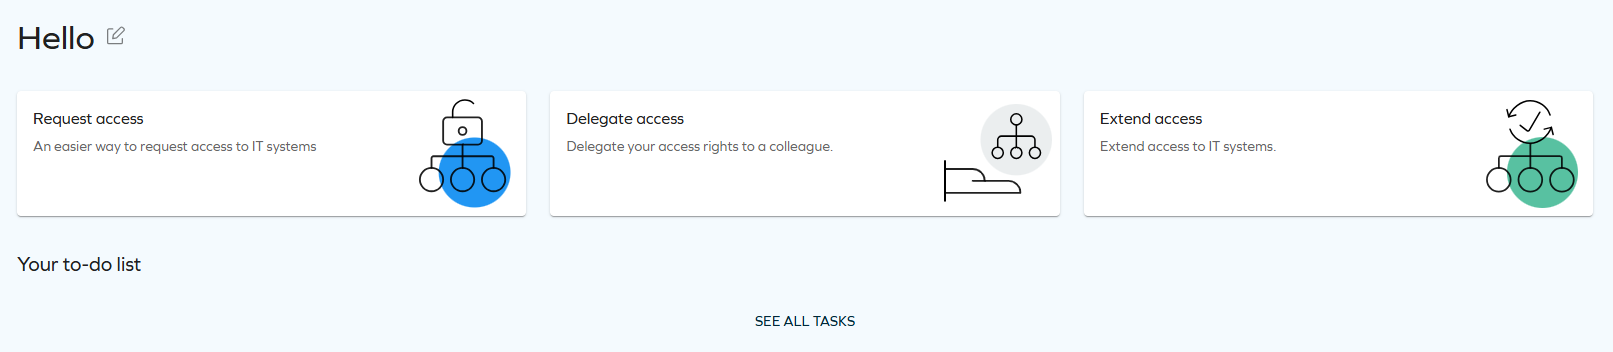
The dashboard is divided into two parts:
-
The upper section shows services, meaning widgets from which the user can carry out one or more actions. By default, Request Access, Delegate Access, and Enroll to password reset are available, but most users have access to more services. Click Services in the left-side menu to open a window from which you can see an overview of all available services.
-
The lower section shows tasks to which a user or administrator must respond, for example, a task that is delegated to the user while another user is away. Tasks are typically related to approving access requests. Click See all tasks to view more.
-
System Administrators can change the settings for the dashboard to show more or fewer services from Setup > Administration > User Interface... > Homepage configuration.
Available dashboards
This section describes the dashboards that are available in the system by default. Depending on your permissions, you may see some or all of these dashboards.
The following components are available in both cloud and on-prem versions by default.
For details on the cloud-only Omada Identity Analytics (OIA) dashboards, see OIA documentation and its subpages.
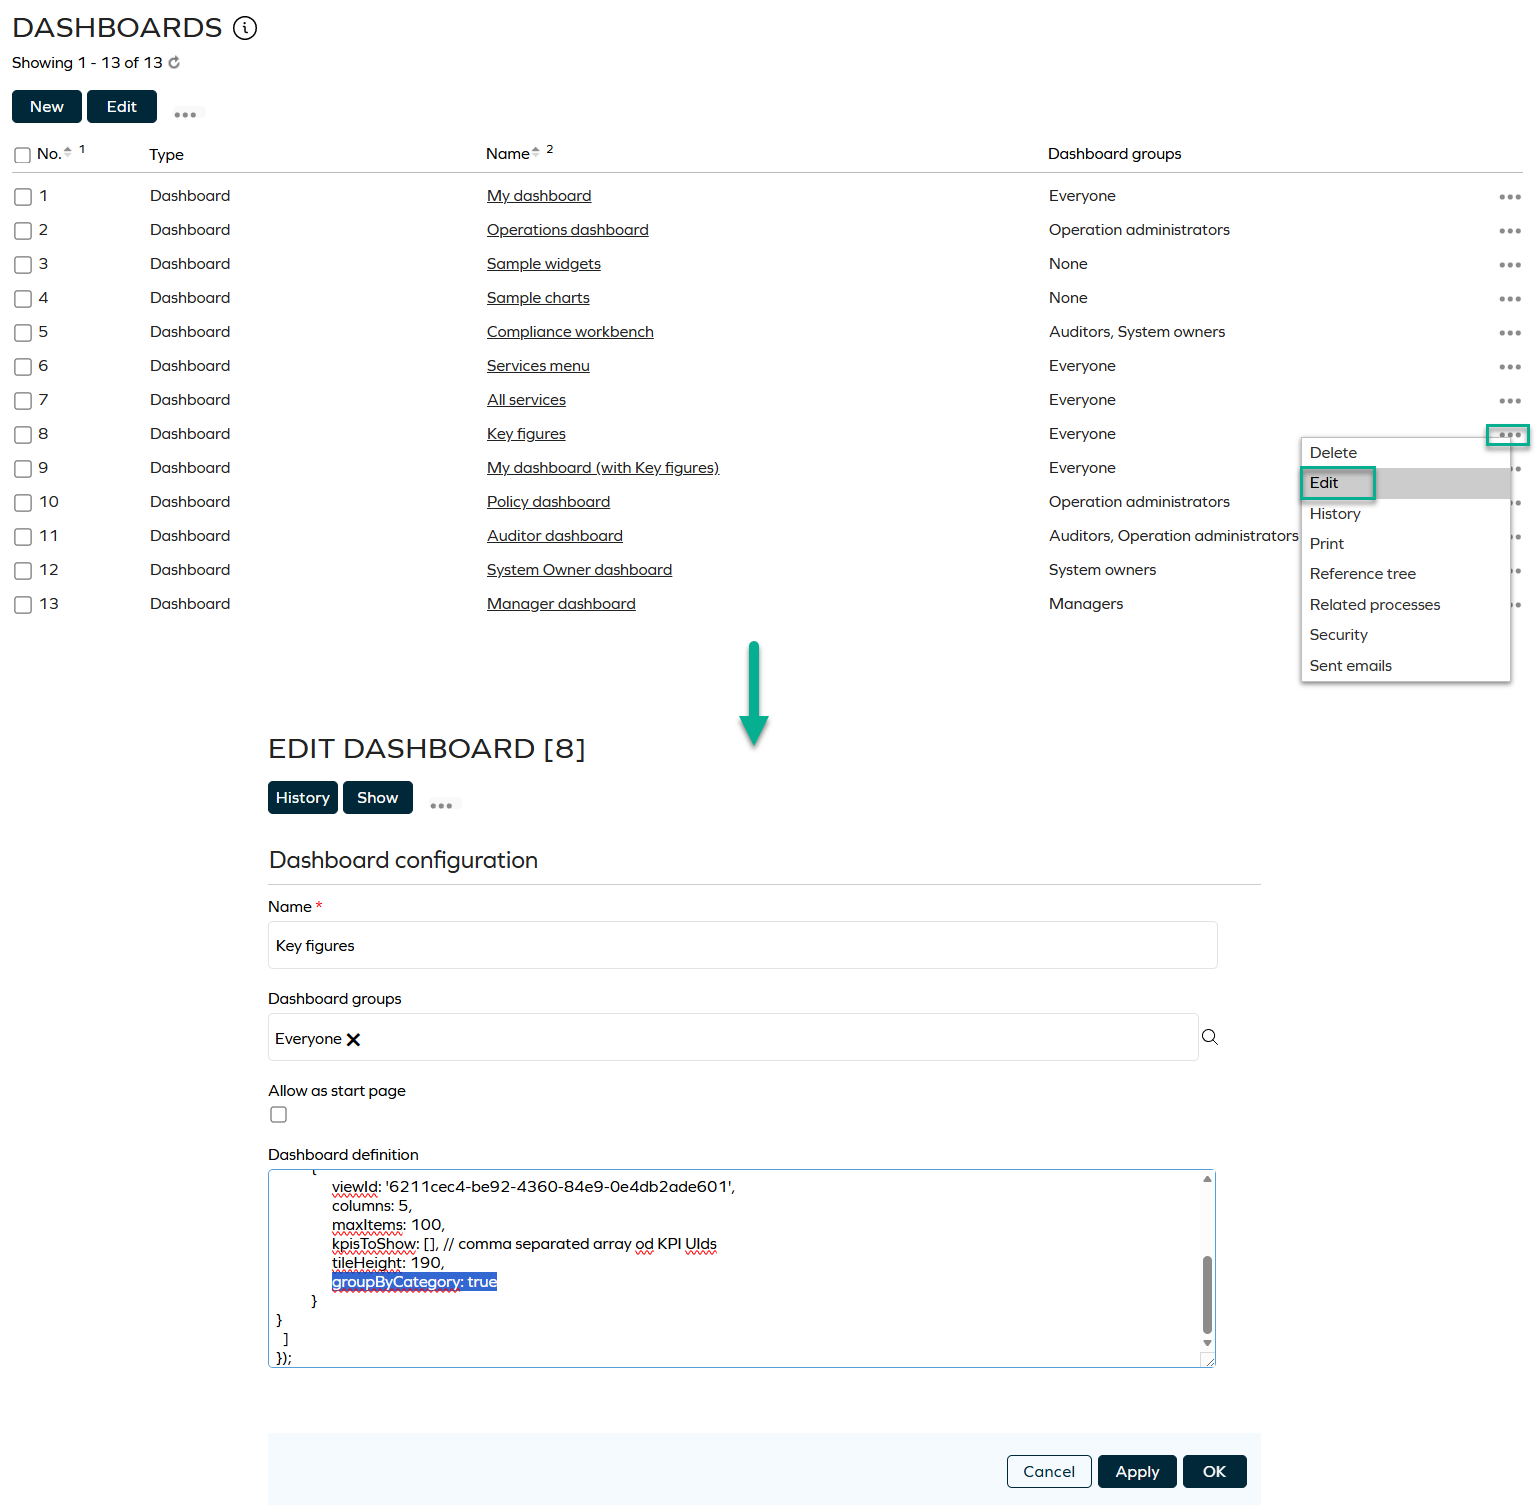
Key Figures dashboard
Key Figures displays all KPIs to which the active user has access. It can be accessed in Dashboards & Analytics > Key Figures.
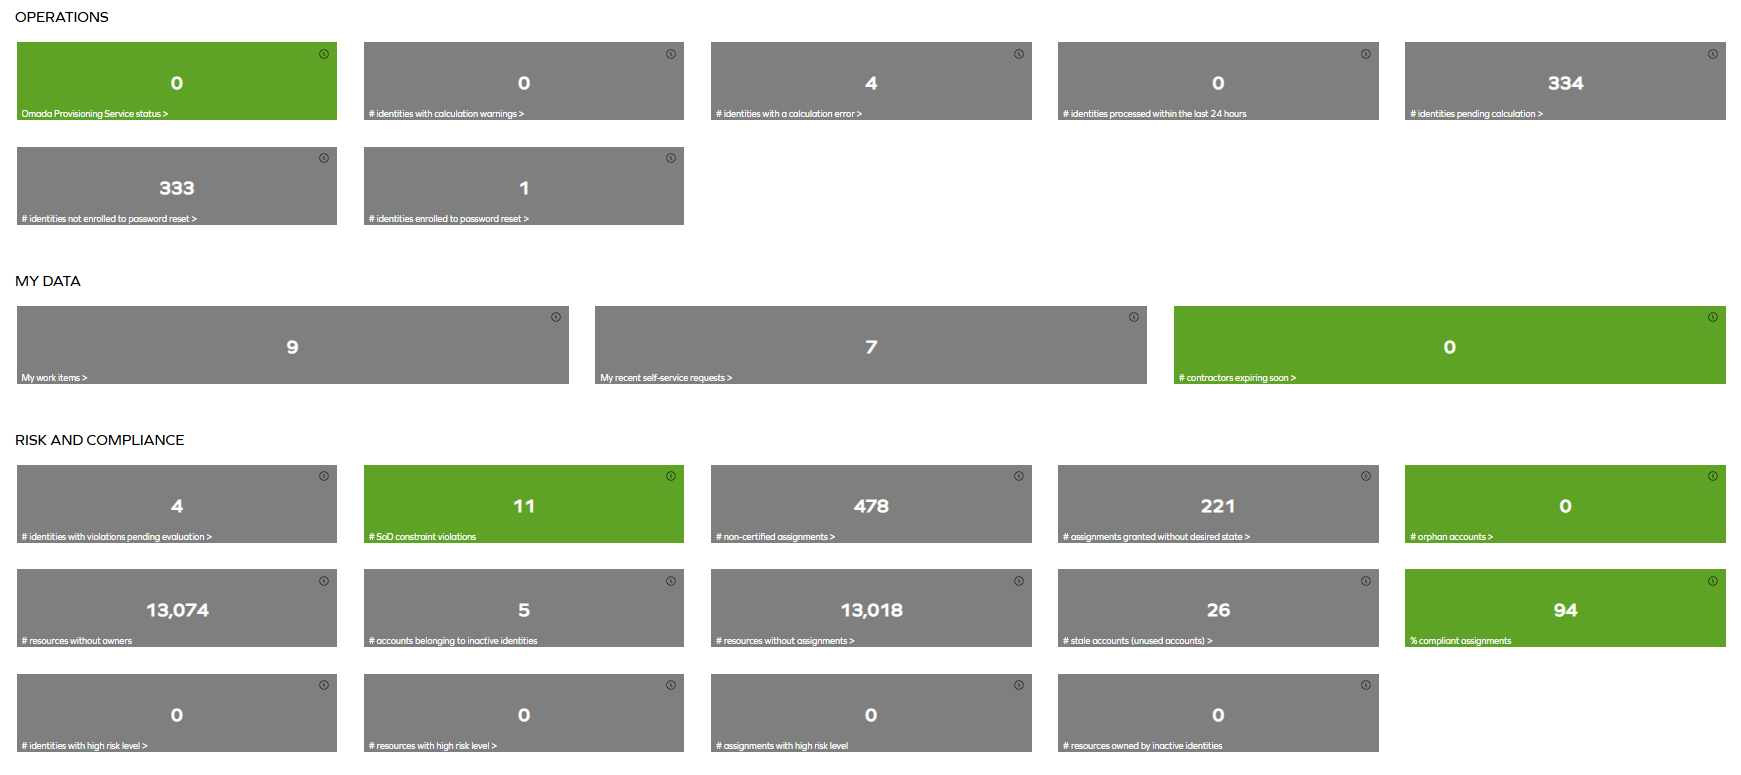

You can group KPIs by categories. The default categories are:
- Operations
- My data
- Risk and compliance
- Recertification
- Master data
- Process efficiency
To enable this feature, edit the Key figures dashboard and set the groupByCategory value to true. You can configure this for other dashboards as well.
Key Performance Indicators
Key Performance Indicators show key data in your application.
Some KPIs have a drill-down action defined. Usually, the action shows a grid with the data that is counted for the KPI. If the KPI name is appended with ">", the KPI has a drill-down action defined. If you click the information icon ("i"), you can see the description of the KPI.
KPIs can have a threshold defined by an administrator. If they do, the status of the KPI will be marked with an appropriate color. Depending on the KPI Tiles widget style selected, the status will be marked with:
-
a color bar underneath the KPI result (previous versions):
-
a colored KPI tile (newest versions):
The color can be green, yellow, or red. Green indicates that everything is correct, yellow that the KPI should be monitored, and red that action should be taken. If no thresholds are defined for a KPI, for example, if the KPI is an object counter, the tile is grey.
For more details on the Key Performance Indicators, see:
KPI Tiles widget
The KPI Tiles widget is used to display the most important Key Figures for a given role.
As an example, the administrator can define a manager dashboard and use the new KpiTiles widget to present the most important Key Figures for managers. If a KPI has a threshold defined, its value will be clearly visible to the user once they sign into Enterprise Server. The color (green, yellow, or red) will indicate the status of the KPI.
Because each KPI is loaded individually into the widget, the order in which the tiles appear may be different at each reload.
Auditor dashboard
This is a predefined dashboard providing data useful for system auditors. By default, it is accessible only to the identities with the Auditor role.
By default, System Administrators may see this dashboard but may not have access to underlying views.
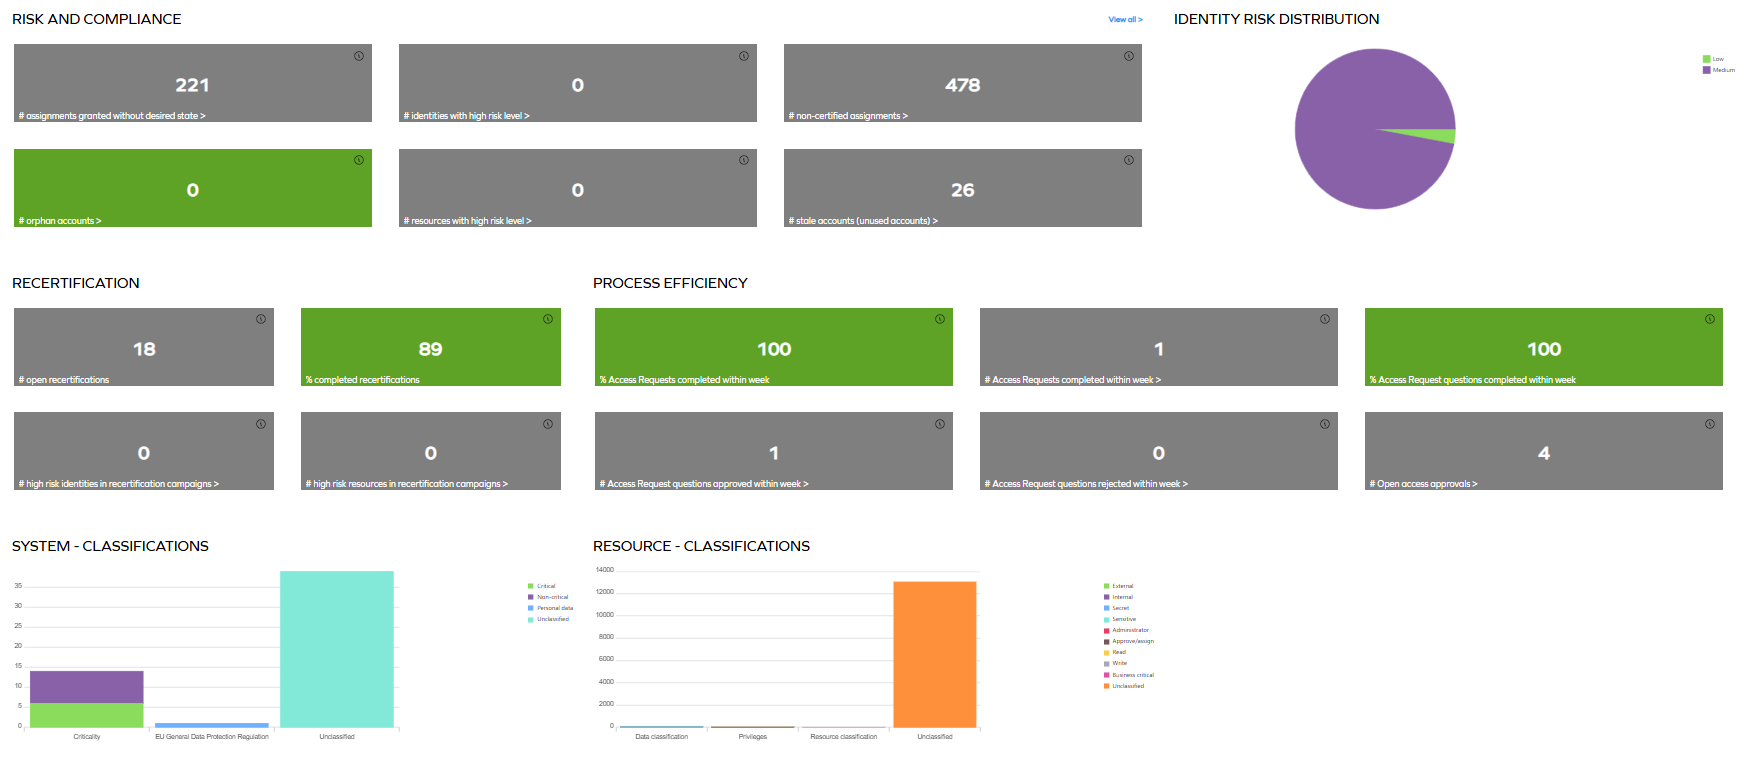
This dashboard is available at Dashboards & Analytics > Auditor dashboard. The dashboard provides quick insight into the following widgets:
-
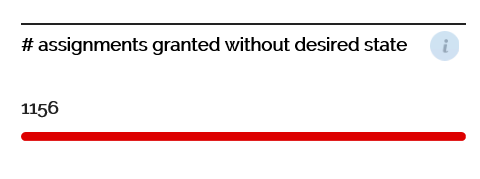
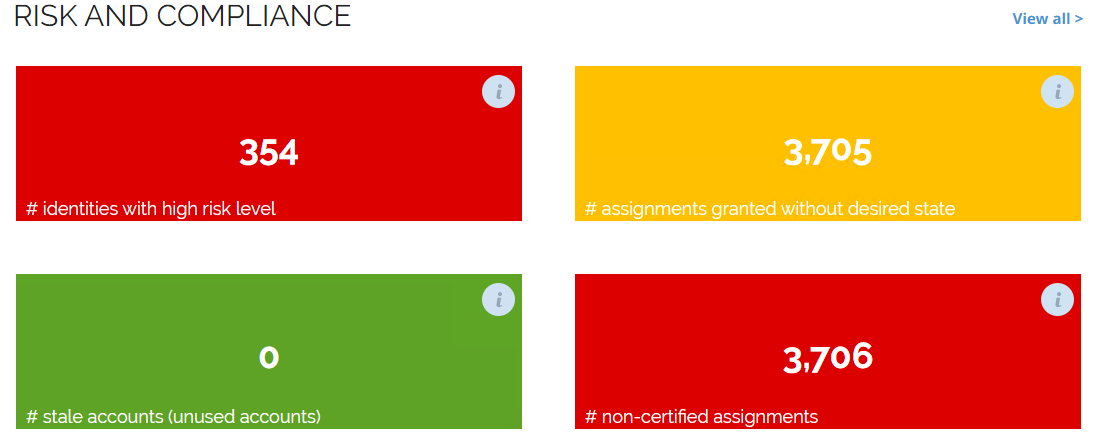
Risk and compliance widget that includes 6 KPIs:
- Assignments granted without desired state
- Identities with high risk level
- Non-certified assignments
- Orphan accounts
- Resources with high risk level
- Stale accounts (unused accounts)
noteTo be able to access all KPIs, you need to be a member of a group that is authorized to view the Key Figures dashboard. The access rights for dashboards can be granted from the Dashboards view, available at Setup > Administration > User Interface > Dashboards.
-
Identity and Risk distribution pie chart
- It displays the distribution of identities per risk level, only including the identities the viewer is allowed to see, that is, filtered on the identities owned by the current user. The legend of the chart lists the available risk levels.
- Click any part of the chart to drill down to the data on identities with the risk level corresponding to the clicked slice of the chart.
- For more information, refer to the Risk guide.
-
Recertification widget (available only in Omada Identity cloud)
- This is a predefined widget providing data useful for Auditors. By default, it is accessible only to the identities with the Auditor role.
- The Recertification widget is predefined to show 4 KPIs:
- Open recertifications
- Completed recertifications
- High risk identities in recertification campaigns
- High risk resources in recertification campaigns
-
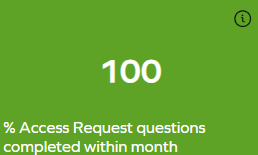
Process efficiency widget
- This widget provides an overview of the efficiency of access request and approval processes. It is predefined to show the following KPIs:
- Percentage and number of access requests completed within a week
- Percentage of access request questions completed within a week
- Number of access request questions completed within a week
- Number of access request questions approved and rejected within a week
- Number of open access approvals
- This widget provides an overview of the efficiency of access request and approval processes. It is predefined to show the following KPIs:
-
System - classifications bar chart widget
-
This bar chart displays information about the classification tags used for all the systems. The tags are grouped by the classification tag category. The chart makes it possible to see the number of systems assigned a given classification tag, as well as see all the unclassified systems. You can drill down to the details of a single bar by clicking the Show button. In the dialog that opens, you can browse and download the data.
noteBoth physical systems and logical applications are taken into account.
The data source query is executed once before the drilldown window opens for listing the columns that will be shown. All columns from the query will be presented.
-
-
Resource - classifications bar chart widget
-
This bar chart displays information about the classification tags used for all the resources. The tags are grouped by the classification tag category. The chart makes it possible to see the number of resources assigned a given classification tag, as well as see all the unclassified resources. You can drill down to the details of a single bar by clicking the Show button. In the dialog that opens, you can browse and download the data.
noteThe data source query is executed once before the drilldown window opens for listing the columns that will be shown. All columns from the query will be presented.
-
Manager dashboard
This is a predefined dashboard providing data useful for Managers. By default, it is accessible only to the identities with the Manager role.
By default, System Administrators may see this dashboard but may not have access to underlying views.
This dashboard is available at Dashboards & Analytics > Manager dashboard.
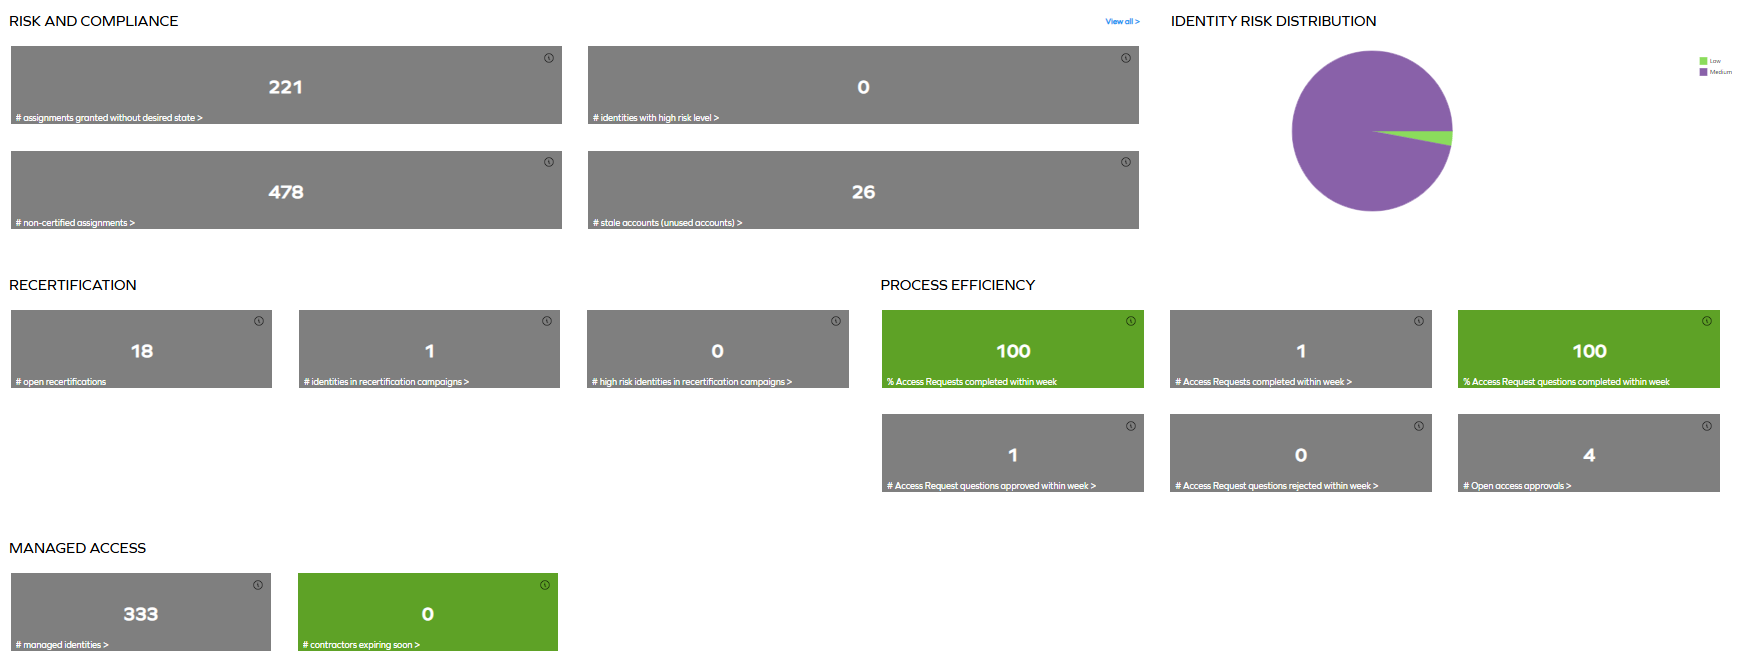
This dashboard provides quick insight into the following widgets:
-
Risk and compliance widget that includes 4 KPIs:
- Assignments granted without desired state
- Identities with high risk level
- Non-certified assignments
- Stale accounts (unused accounts)
noteTo be able to access all KPIs, you need to be a member of a group that is authorized to view the Key Figures dashboard. The access rights for dashboards can be granted from the Dashboards view, available at Setup > Administration > User Interface > Dashboards.
-
Identity and Risk distribution pie chart
- For more information, refer to the Auditor dashboard section.
-
Recertification widget (available only in Omada Identity cloud)
- This is a predefined widget providing data useful for Managers. By default, it is accessible only to the identities with the Manager role.
- The Recertification widget is predefined to show 3 KPIs:
- Open recertifications
- Identities in recertification campaigns
- High risk identities in recertification campaigns
-
Process efficiency widget
- This widget provides an overview of the efficiency of access request and approval processes. It is predefined to show the following KPIs:
- Percentage and number of access requests completed within a week
- Percentage of access request questions completed within a week
- Number of access request questions completed within a week
- Number of access request questions approved and rejected within a week
- Number of open access approvals
- This widget provides an overview of the efficiency of access request and approval processes. It is predefined to show the following KPIs:
-
Managed Access widget
- This widget is predefined to show the managed identities and contractors expiring soon KPIs.
System Owner dashboard
This is a predefined dashboard providing data useful for System Owners. By default, it is accessible only to the identities that are owners of any systems in the application.
By default, System Administrator may see this dashboard but may not have access to underlying views.
This dashboard is available at Dashboards & Analytics > System Owner dashboard.
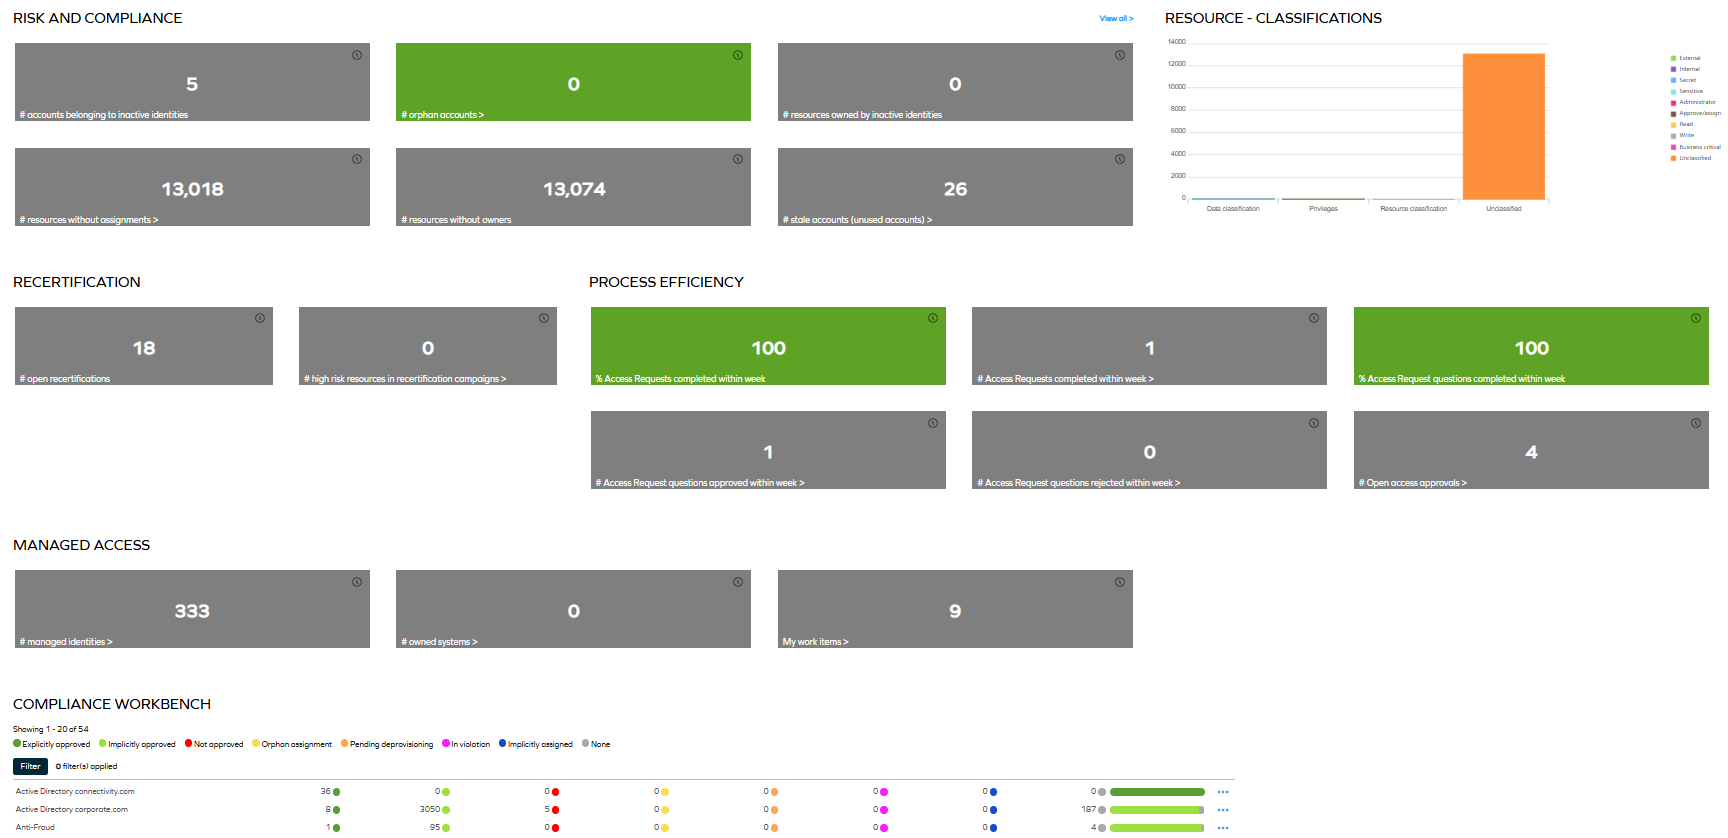
This dashboard provides quick insight into the following widgets:
-
Risk and compliance widget is predefined to show 6 KPIs:
- Accounts belonging to inactive identities
- Orphan accounts
- Resources owned by inactive identities
- Resources without assignments
- Resources without owners
- Stale accounts (unused accounts)
noteTo be able to access all KPIs, you need to be a member of a group that is authorized to view the Key Figures dashboard. The access rights for dashboards can be granted from the Dashboards view, available at Setup > Administration > User Interface > Dashboards.
-
Resource - classifications bar chart
- For more information, refer to the Auditor dashboard section.
-
Recertification widget (available only in Omada Identity cloud)
- This is a predefined widget providing data useful for System Owners. By default, it is accessible only to the identities with the System Owner role.
- The Recertification widget is predefined to show 2 KPIs:
- Open recertifications
- High risk resources in recertification campaigns
-
Process efficiency widget
- This widget provides an overview of the efficiency of access request and approval processes. It is predefined to show the following KPIs:
- Percentage and number of access requests completed within a week
- Percentage of access request questions completed within a week
- Number of access request questions completed within a week
- Number of access request questions approved and rejected within a week
- Number of open access approvals
- This widget provides an overview of the efficiency of access request and approval processes. It is predefined to show the following KPIs:
-
Managed Access widget is predefined to show 3 KPIs:
- Managed identities
- Owned systems
- My work items
-
Compliance Workbench
- This is a widget based on the Compliance Workbench. The Compliance Workbench is a user interface for System Owners and Auditors to help make a system or application compliant. It shows an overview of the compliance statuses of all the resource assignments for each system or application. You can filter by applications, systems, or resources.
noteWhen you reduce the size of the browser window, the context menu displayed when you click any ellipsis menu of the Compliance Workbench may pop up at the top of the window rather than in the Compliance Workbench. To solve this issue, make sure to keep the browser window maximized.
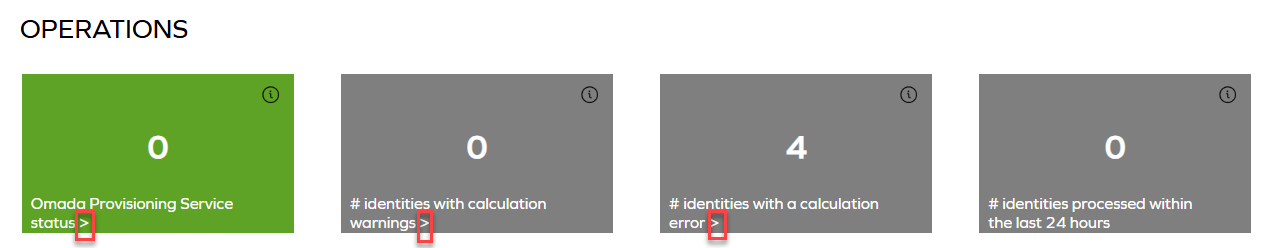
Operations Dashboard
This dashboard is available to System Administrators and Operations Administrators. It provides an overview of the system operations, such as imports, provisioning jobs, and RoPE calculations. It also shows the status of analytics processing in the system and an overview of system-level import and provisioning statuses.
The Operations Dashboard shows the operations states in five categories. It enables Operations Administrators to get a quick overview of the individual states, both in relation to tasks with problems and to the throughput of the four main engines.
You can find the Operations Dashboard by going to Setup > System operation > Logs > Operations Dashboard.
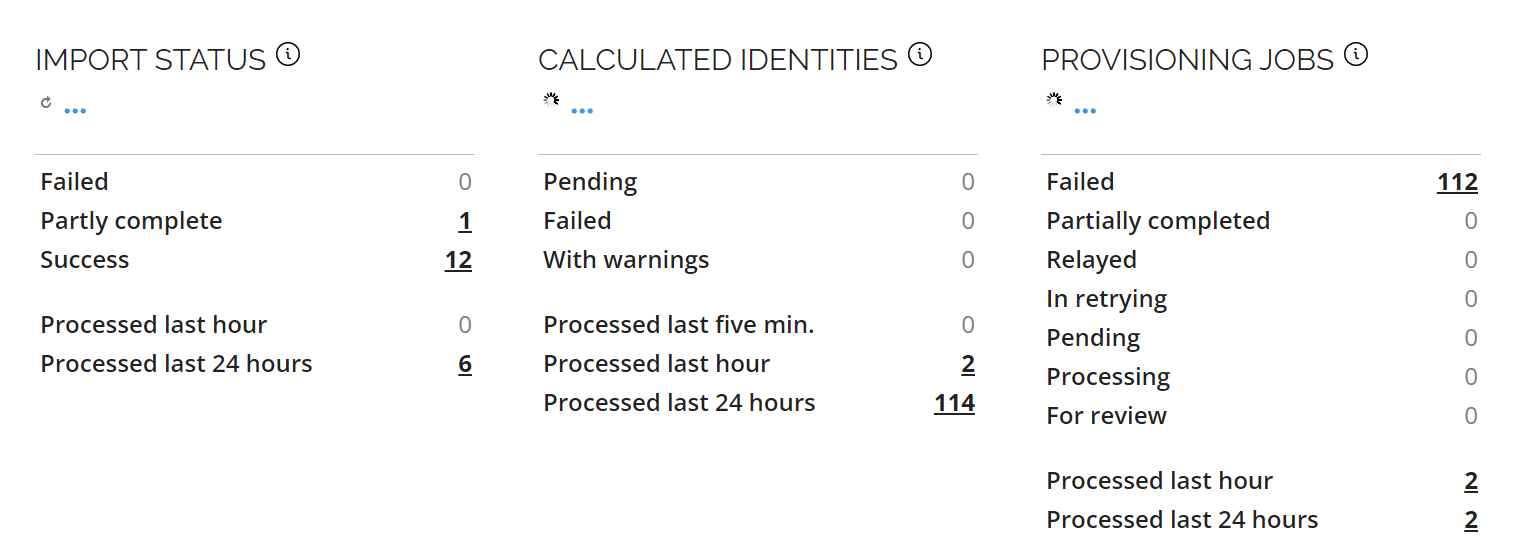
The dashboard consists of five widgets:
Import status
Import status lists various statuses for your imports. The following is a list of the displayed statuses:
-
Failed - shows the number of failed imports.
-
Partly complete - shows the number of imports that completed with one or more warnings.
Horizons feature enabledWith the Horizons feature enabled, the With warnings status is replaced with a Partly complete one. For more information, go to Operations Dashboard.
-
Success - shows the number of successful imports.
-
Processed last hour - shows the number of imports that the system has processed within the last hour.
-
Processed last 24 hours - shows the number of imports that the system has processed within the last 24 hours.
-
Potentially stale - indicates whether the import data may be outdated.
Click on the number displayed for any of those statuses to find out the execution details.
Calculated identities
Calculated identities displays the number and statuses of the calculation of identities done by the Role and Policy Engine. The following is a list of the displayed statuses:
- Pending - shows the number of identities that are pending calculation.
- Failed - shows the number of calculated identities that failed.
- With warnings - shows the number of calculated identities with warnings.
- Processed last five min. - shows the number of calculations of identities that RoPE has processed within the last five minutes.
- Processed last hour - shows the number of calculations of identities that RoPE has processed within the last hour.
- Processed last 24 hours - shows the number of calculations of identities that RoPE has processed within the last 24 hours.
Click on the number displayed for any of those statuses to find out the calculation details.
In the ellipsis menu of this widget you have the following options:
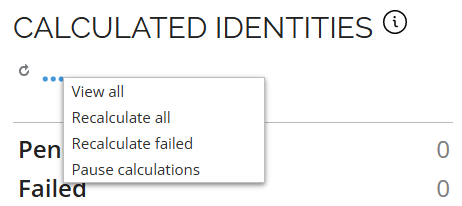
-
View all calculated identities.
-
Recalculate all identities in a system directly from the UI, without having to execute the stored procedure
RoPE.spAddAllToQueue.noteThis option is also available in the Identities view.
-
Recalculate failed identities (only the identities for which the calculation failed are added again to the RoPE queue for recalculation).
Queueing Identity for RecalculationTo queue identity for recalculation, you must have the QueueIdentityForRecalculation permission assigned.
By default, this authorization element is assigned to the Administrators, Data Administrators, Operation Administrators, and ServiceDesk roles. This authorization element hides the Recalculate option for users without proper access permissions.
-
Pause calculations / Resume calculations
The Pause/Resume RoPE calculations feature allows you to control the calculation process directly from the Operations Dashboard without interrupting any services. The button's label dynamically reflects the current state of RoPE calculations.
Pause calculations
When you click Pause calculations, a confirmation message is displayed. If you confirm, the system sets the
Pausedsetting to true, and a yellow banner appears at the top of the screen with the following message:messageRoPE calculations are paused. To resume, go to the Calculated identities context menu and click Resume calculations.
While no new calculations will be initiated, any ongoing calculations will continue until they are completed.
Resume calculations
When you click Resume calculations and confirm, the system sets the
Pausedsetting to false. This enables RoPE to start processing new calculations.
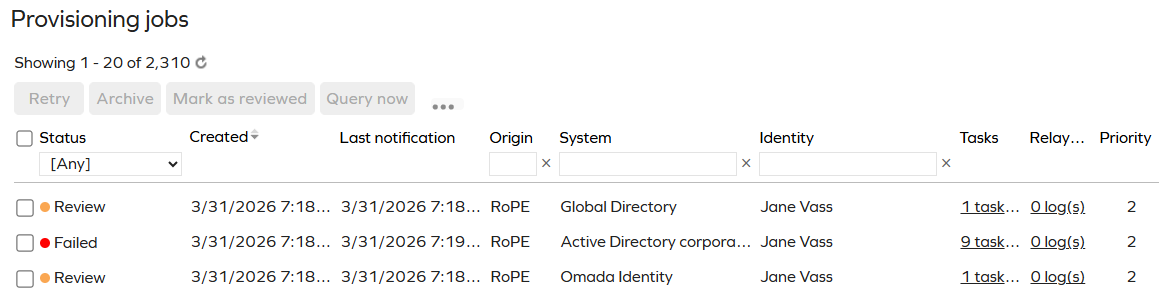
Provisioning jobs
Provisioning jobs shows the status for OPS. It displays the number of jobs that are processed, pending, failed, relayed, or set for a review. The following is a list of the displayed statuses:
-
Failed - the number of failed provisioning jobs.
-
Partially completed - the number of provisioning jobs for which at least one task has failed, and at least one task has been successful.
-
Relayed - the number of provisioning jobs that have been relayed to an external system.
When you click the number next to Relayed, an additional Query now button and Relayed column are present:
-
The Query now button allows you to query the external provisioning system on the status of the relayed jobs. By clicking on the number of tasks in the Tasks column, a screen with a detailed list of tasks is displayed.
-
By clicking the number of logs in the Relayed column, you can display a detailed list of the provisioning jobs relayed to an external system. Additionally, this list allows you to look through the properties of the relayed provisioning jobs. You can view the properties by clicking the number in the Properties column.
infoBy clicking the Execution log details in the task result dialog box, you can see the anchor returned by the task. In the task details page you can find the
JobAnchorvalue. For mappings utilizing theJobAnchor, the actual value is not visible. Instead, the use of theJobAnchoris indicated.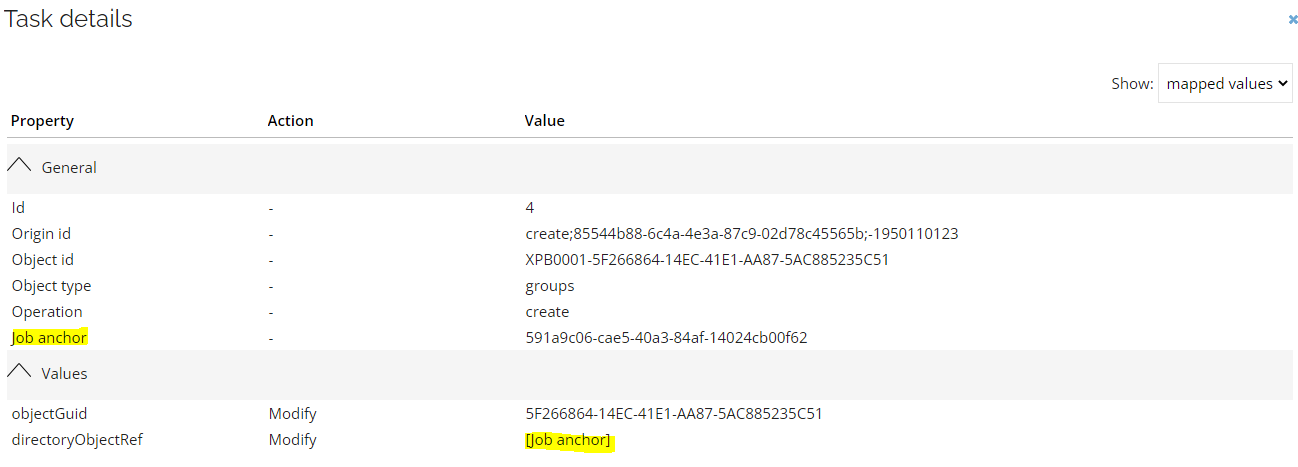
-
-
In retrying - the number of provisioning jobs that have failed and are being retried.
-
Pending - the number of provisioning jobs that are pending provisioning.
-
Processing - the number of provisioning jobs that are processed, ensuring that jobs with this status are not rescheduled.
-
For review - the number of jobs that await review by an administrator.
-
Processed last hour - the number of provisioning jobs completed successfully by OPS within the last hour.
-
Processed last 24 hours - the number of provisioning jobs completed successfully by OPS within the last 24 hours.
If Cloud Application Gateway is enabled, you can also view details related to system heartbeats.
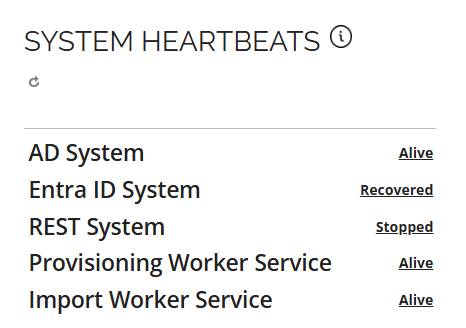
System heartbeats shows the status of the systems, workers, and import services based on the last recorded heartbeat. The following is a list of the displayed statuses:
- Available - the recorded value indicates that the process or system is functioning correctly and the heartbeat value is below the configured threshold.
- Stopped - the recorded value exceeded the configured threshold and restart attempts failed with the system or process remaining in the stopped status.
- Recovered - at some point the recorded heartbeat value has exceeded the configured threshold. It was followed by a successful restart attempt granting system or process recovery.
You can click the number displayed next to each status. This link allows you to open a detailed list of jobs with additional information on each job, such as creation and last modification dates, system to which job is connected, number of tasks within the job, and priority.
By clicking the ellipsis menu of the Provisioning jobs widget, you can choose View all or Provisioning claims.
-
The View all option allows you to view all provisioning jobs in a pop-up window, where the Retry button allows you to retry the specific failed job.
-
The Provisioning claims option opens a new window with the list of all provisioning claims that are not yet expired.
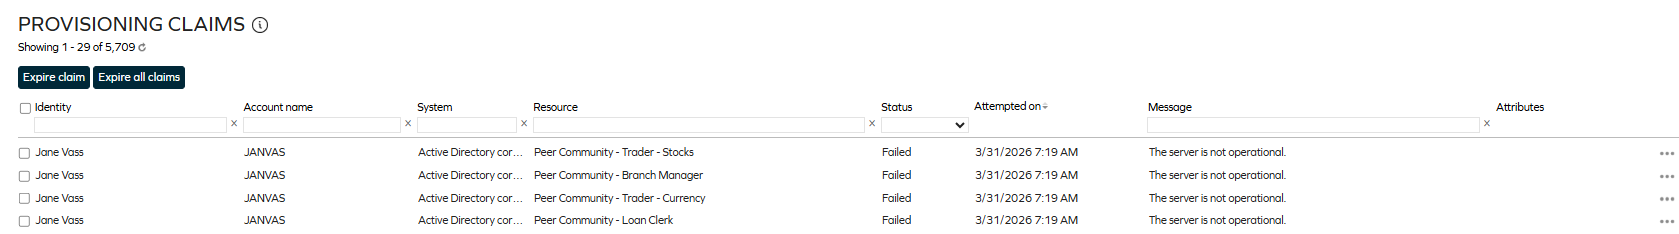
This transfers you to the Provisioning Claims table, also available in the Setup > Operations > Provisioning Claims section, where failed provisioning claims can be expired by selecting Expire claim option from the context menu.
noteWhen a claim is expired, the identity for which the claim was created is then queued for recalculating in RoPE, and a new provisioning job will be created.
Analytics processing
Analytics processing shows the status of analytics processing in the system. The following is a list of the displayed items:
-
Last update - shows the timestamp of the last analytics processing run.
-
Inconsistencies - shows the aggregated number of inconsistencies detected during analytics processing. Click the number to open a detailed view.
importantThis widget is important to history tracking. For details on handling inconsistencies, see Horizons - Tracking history of data objects.
Systems overview
Systems overview shows an overview of system-level import and provisioning statuses. The following is a list of the displayed statuses:
- Import errors - shows the number of import errors across all systems.
- Import warnings - shows the number of import warnings across all systems.
- Requires thresholds migration - shows the number of systems that require thresholds migration.
- Import thresholds violation - shows the number of systems with import threshold violations.
- Provisioning errors - shows the number of provisioning errors across all systems.
- Prov. thresholds violation - shows the number of systems with provisioning threshold violations.
Items status and refresh rate
The common status for all the widgets shows the number of processed items for the last hour and the last 24 hours. The Calculated identities widget also shows a status for the last five minutes.
The data in the widgets refreshes automatically every 15 seconds by default, but you can change the refresh rate individually in the dashboard configuration. Go to Setup > Administration > User interface > Dashboards and click Operations Dashboard. In the Dashboard definition, find and edit the instances of refreshRate: 15 that you want to change.
If you click a number in a widget, a dialog box opens. This dialog shows a detailed view of the items filtered on the status, for example, on the picture below, there are 318 failed provisioning jobs:
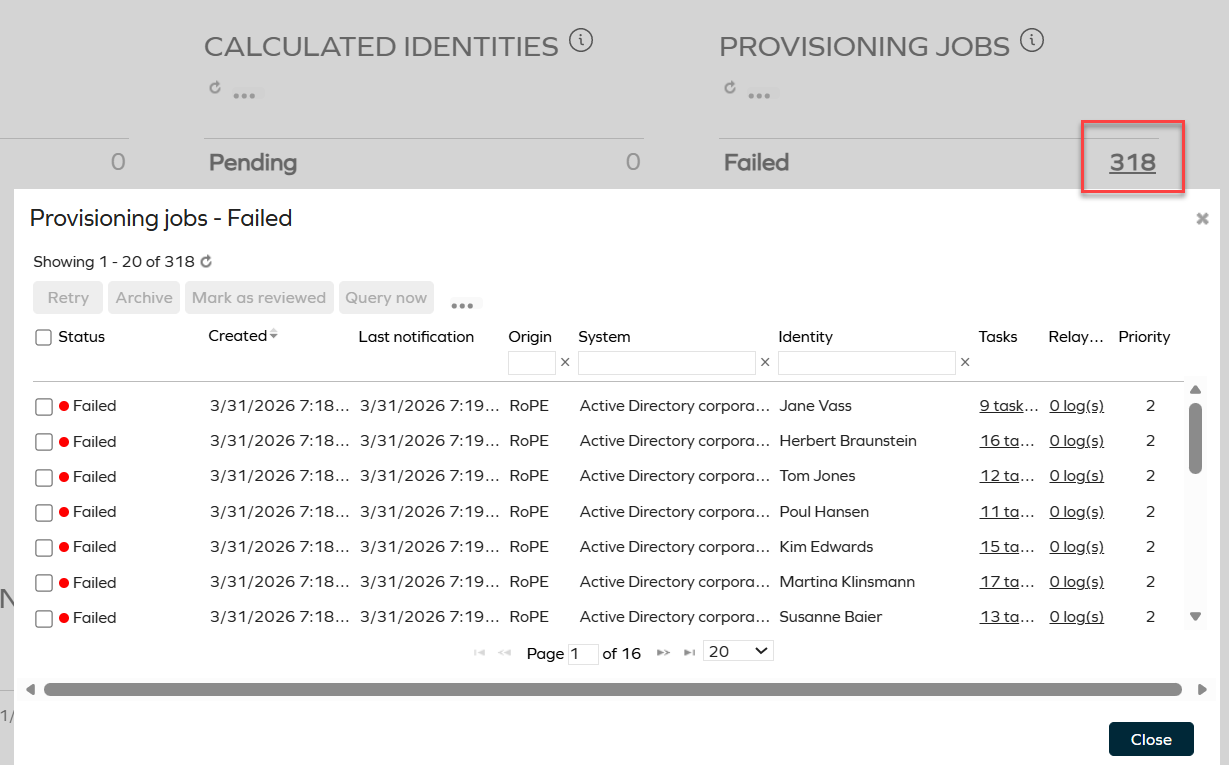
In the case of failed jobs, the Retry button allows you to retry the specific failed job.
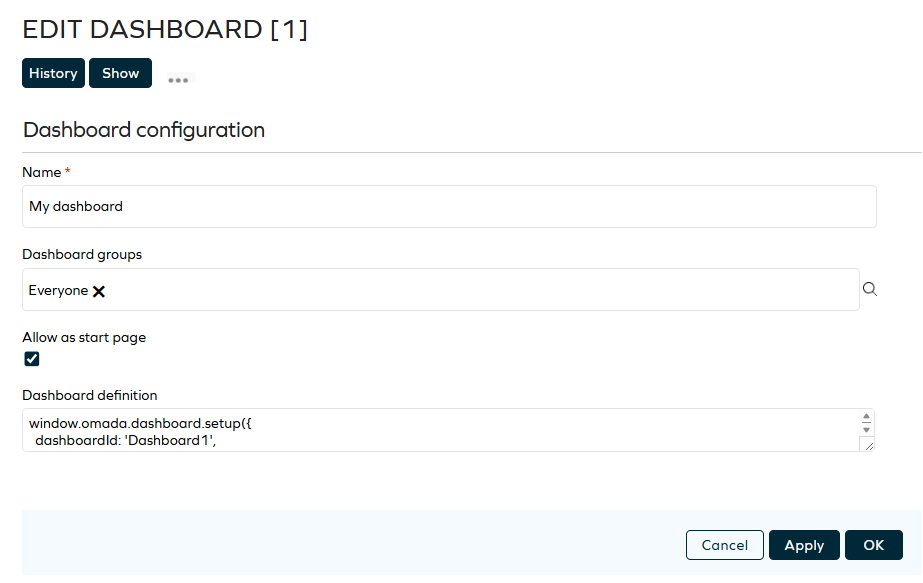
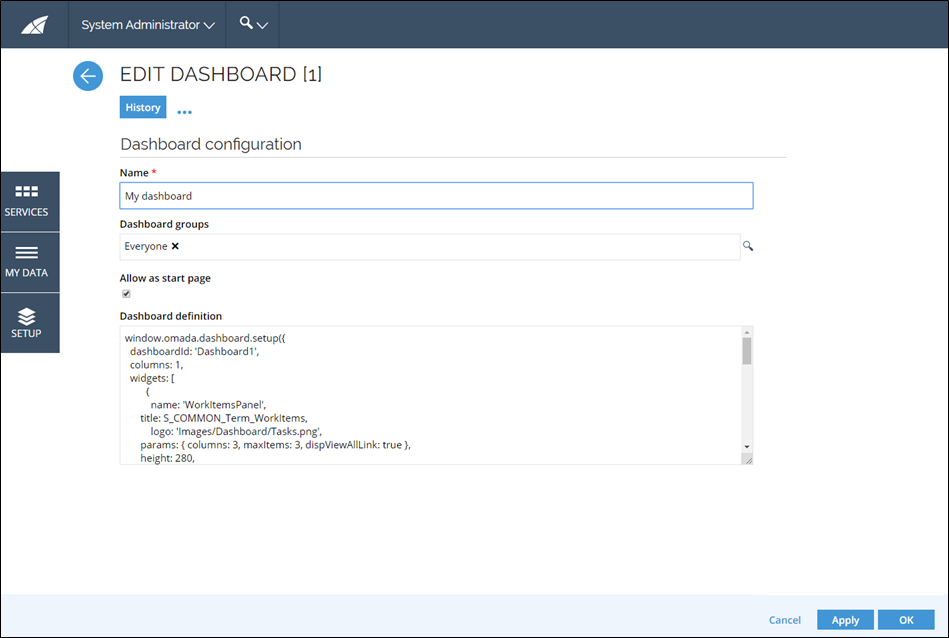
Configuring dashboards
The Dashboards view includes a list of available dashboards. It is located in Setup > Administration > User Interface... > Dashboards. From this view, you can configure the available dashboards or click New to define a new dashboard.
You must use JavaScript to configure a dashboard. The configuration of the JavaScript allows you to specify the exact widgets to display in the relevant dashboard. You must also specify to which user groups to display the dashboard. This allows you to define relevant dashboards to different types of users.
Dashboard configurations, including access, are cached in the application, so changes are not reflected immediately. You can enable Configuration Mode on non-production environments while testing dashboard customizations.
Widget configuration options
| Parameter | Description |
|---|---|
| Name | Defines the name of the widget to show. The name must correspond to the available widget. The following built-in widgets are available: TextPanel WorkItemsPanel MyWorkItems Chart KPIList ComplianceWorkbench OPS |
| Title | Defines the title of the widget. |
| hideTitle | Use this option to hide the title bar of the widget if needed. |
| colSpan | Indicates how many columns the widget should span. The value cannot exceed the number of columns in the dashboard. |
| height | Defines the height of the widget in pixels. |
| actions | Holds a collection of widget menu items. It is an extension point where you can call a JavaScript function. The actions take these parameters: name: identifier for menu item (required) title: title for menu item icon: the name of icon for menu item tag: an optional object which is passed to the callback function callback: a function which receives an 'options' object action: the 'name' of the action tag: the object specified for the action Example: actions : [ { name: 'newAction', title: 'New', icon: 'show', tag: {}, callback: function(options){alert('hello from widget')} } ], |
| minWidth | Defines the minimum width of the widget in pixels. It will prevent the actual width of the widget from being smaller, for instance, when resizing the browser window. |
| reduceDynamicWidthBy | An optional parameter that can be used to reduce the size of a widget. The purpose is to control the size of the widget and prevent the misplacing of the context menu of the widget (if there is one) if the browser window is filled in and the given widget is displayed at the bottom of a dashboard. |
| Params | Holds widget-specific parameters. |
The width of widgets is always adjusted to the available space in the browser window. In contrast, the height of a widget is always static.
Adding sample dashboards
Omada Identity includes two sample dashboards. These two dashboards are not assigned to any user groups by default. If you want to make them visible to a user group, edit the dashboard and add one or more user groups to the Dashboard groups setting and add a menu item to display the dashboards. See more below:
- The Sample widgets dashboard shows examples of the widgets available that are not module-specific.
- The Sample charts dashboard shows examples of the types of charts available.
The Sample charts dashboard does not show an example of the pie chart.
You must manually add a menu item to allow for UI access to the dashboards by creating a new folder in the Menu Structure and adding the URL to the new menu item.
To add sample dashboards to left-side menu:
-
Go to Setup > Administration > User Interface... > Menu Structure.
-
Scroll through the menu structure to find a relevant level in the menu to place the new menu item, for example, Setup > Administration > More..., then click New.
-
On the Menu Item page, type a name for the menu item, for example, Sample dashboard or the default name of the dashboard.
-
In the Url field, type the direct URL for the dashboards:
- Sample charts:
dashboard.aspx?dashboard=sample%20charts - Sample widgets:
dashboard.aspx?dashboard=sample%20widgets
- Sample charts:
-
Optionally, in the Vertical order list, move the menu item up or down within its level in the menu.
-
When you are done, click OK to save the settings and close the page.
-
Refresh your browser window. The menu item showing your dashboard should now be available.
Changing default dashboard
You can select a Default Dashboard that will be presented to you after signing into the Omada Identity. The setting is available on the My Settings page.
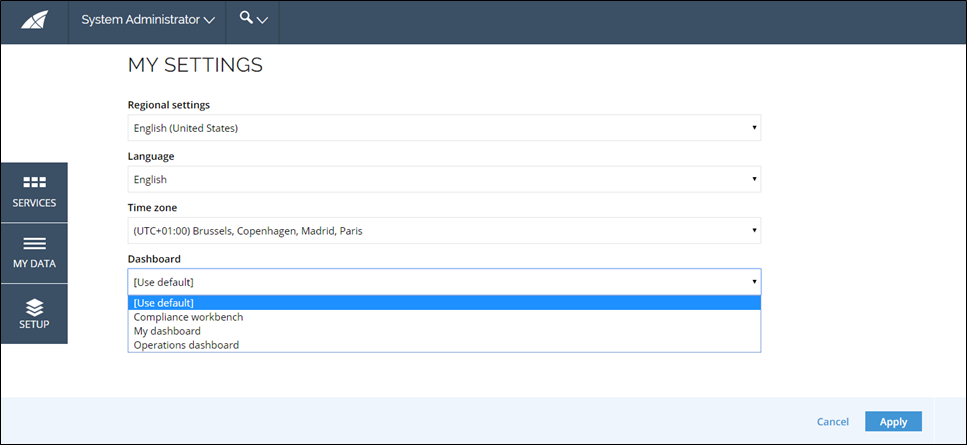
You can select the default dashboards only from the set of dashboards you have access to. To do so, select one of the available dashboards from the Dashboard dropdown list.
If you haven't selected the default dashboard yet, or if you've selected the Use Default setting, you will be presented with a dashboard that matches the default dashboard for the system, even if it changes.
If an error is displayed at the first loading of a dashboard, refresh the page to fix the issue.
Overriding default dashboard for users
Administrators can override the Default Dashboard setting for any user from the Users menu (Setup > Administration > More > Users & Security > Users > select user > Other settings).
To specify which dashboards can be selected by a user to be visible as their start page, administrators can use the new Allow as start page property defined for the Dashboard object type. Only the dashboards that have this property enabled are available for selection by users.
By default, this property is enabled for the following dashboards:
- My dashboard
- Operations dashboards
- Compliance workbench
Even if a dashboard is set up as not being selectable, it can still be defined as the default dashboard and will be displayed as the start page for users using the Use default setting, which is the default value for all users.
Some of the dashboards are not available for use as a start page, for example, the Services Menu dashboard.
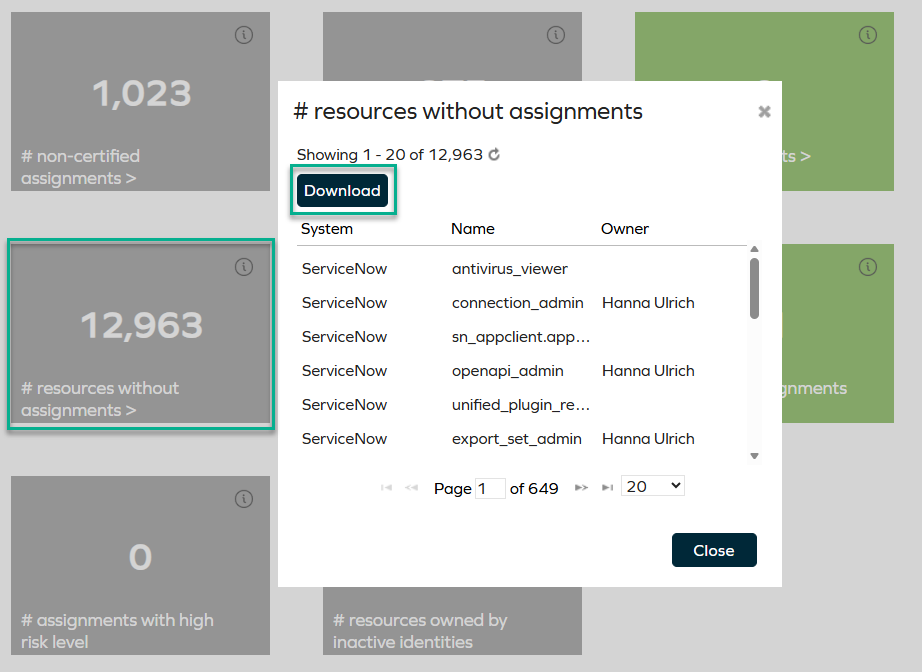
Export drill-down results
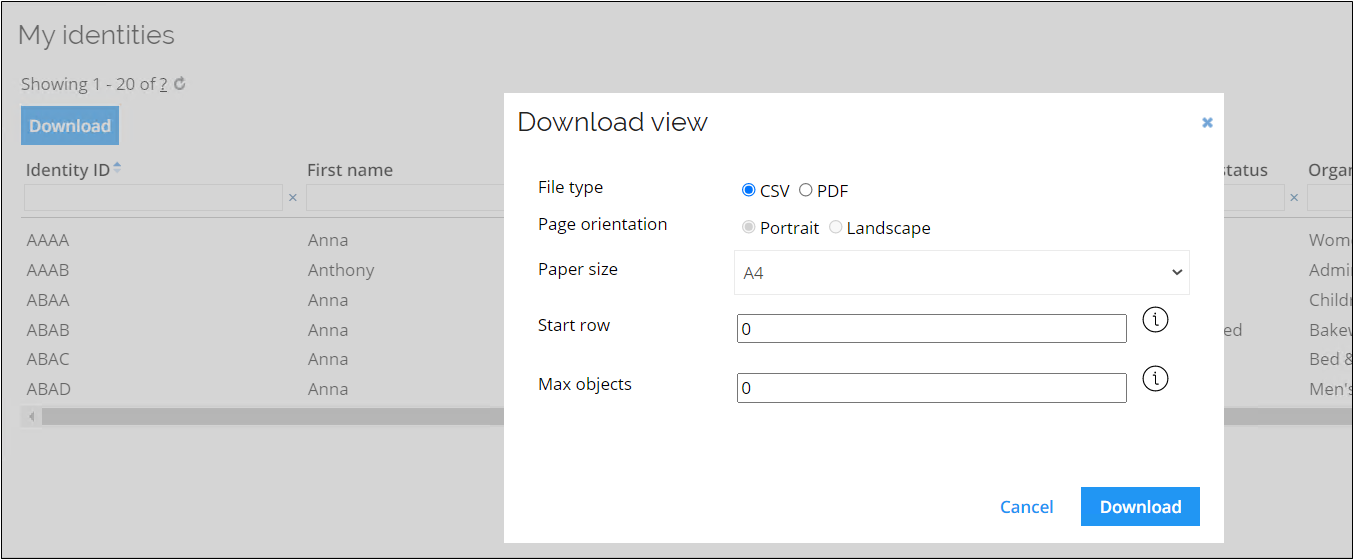
The KPI drill-down results can be exported to a .csv file so you can access the exact drill-down data.
KPIs from view are distinguished by having the counter type="view" type, and KPIs from tabular model by having the countertype="scalarDataSource" type in KPI definition in the Setup > Administration > More > Key Performance Indicators.
An example of the view type KPI is the managed identities KPI. You can download the data file in either the .csv or .pdf format.
You cannot download custom KPI data.
An example of the scalarDataSource type KPI is the resources without assignments KPI.
For more information on managing dashboards, refer to the Admin configuration section.