Monitoring system configuration
To properly maintain, plan, audit, and troubleshoot a system, it is vital to monitor many of its important configuration settings. Omada Identity registers several types of information in logs to use for tracking issues, compliance, usage, and more.
This chapter describes the location of the logs and the way you can use the logs in Omada Identity Data Warehouse (ODW). In this section, you can find descriptions of the logs found in Omada Identity, Windows Event Viewer, and Omada Identity Data Warehouse.
You can access the logs in either the Omada Identity Portal or the Omada Identity database. You must have access to use the SQL server and the Windows Event Viewer on the machine on which you have installed Omada Identity.
In addition to the logs, Omada Identity provides four system statistics reports to complete the monitoring tools.
Monitoring the status of Omada Identity Data Warehouse configuration is important for maintaining high performance. By analyzing the findings of the monitoring activities, you can speed up both imports and reports, and you can avoid inefficient use of disk space.
It is also important to monitor the outcome of each Omada Identity Data Warehouse's import to make sure that the data in ODW is accurate and up to date.
Location of logs
Depending on the type of logged data, you can monitor system functionality in the Omada Identity Portal, the Omada Identity Data Warehouse database, or the Windows Event Viewer. The following table presents the types of logged data:
| Components | Logs available |
|---|---|
| Enterprise Server | Page activity log, code method log, email log, data exchange log, system log, and timer log. |
| Omada Identity Portal | Code method log, email log, data exchange log, timer log, and system statistics. |
| Omada Identity Data Warehouse | Import log, Omada Identity Data Warehouse Syssislog. |
| Windows Event Viewer | Enterprise Server errors log, RoPE errors log. |
| SQL Management Studio | SQL Server Agent Jobs log. |
Event viewer
To find the Event Viewer, go to Start > Control Panel > Administrative Tools > Event Viewer.
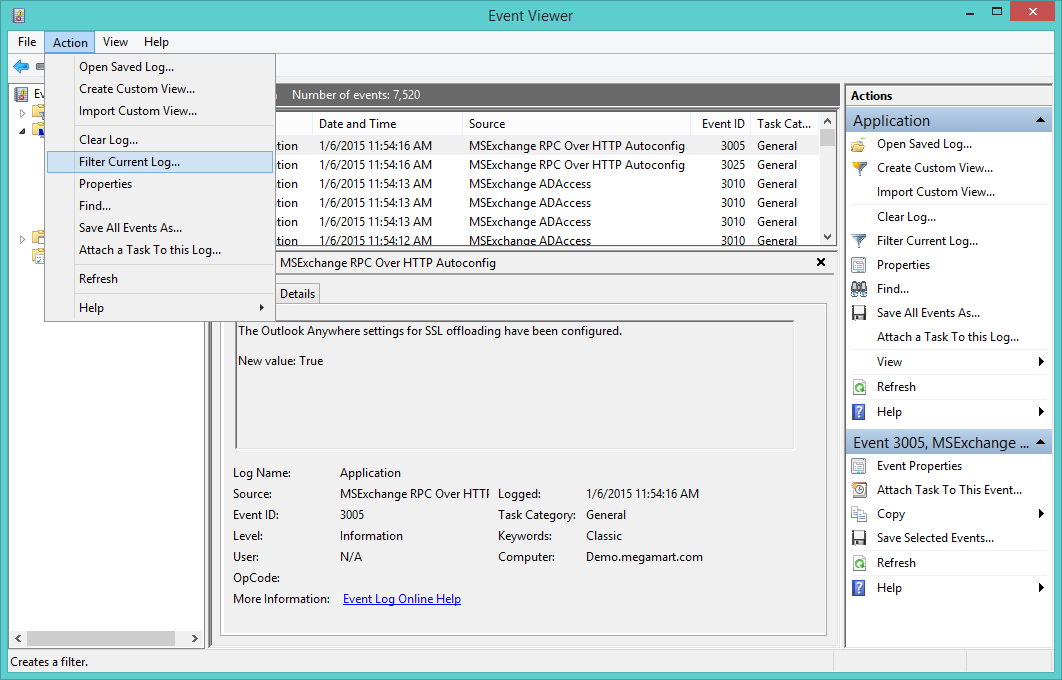
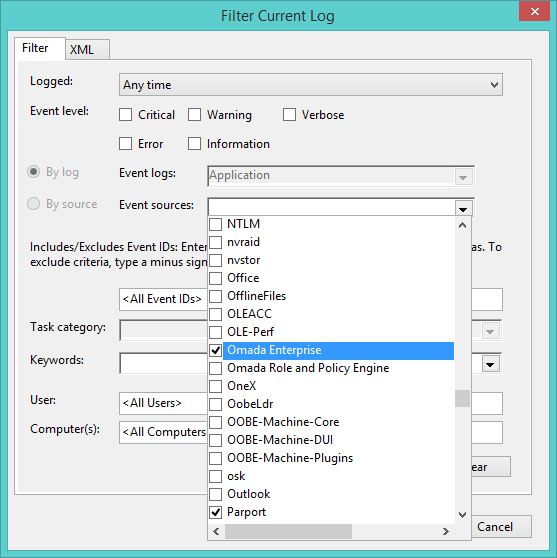
The source name for errors is Omada Enterprise, and errors are logged to Windows logs > Application.
You can use the filter in the Event Viewer to locate these errors quickly.
The logs are placed in a category according to their EventId.
When you start using Omada Identity, the system checks and verifies that all configured code methods and access modifiers are located in the specified assemblies.
If the system cannot find one or more code methods or access modifiers, Omada Identity records an event in the event log.
Log overview
Expand each section to learn more about given log type:
Page activity log
All user access to web pages that are a part of the Omada Identity are logged in to the dbo.tblActLog table in the database.
Writing logs to the dbo.tblActLog table can be managed by setting the EnableActivityLog customer setting to the desired value:
- If this setting is enabled, logs are written to
tblActLogtable. This is the default value for on-premise customers. - If this setting is disabled, logs are not written to
tblActLogtable. This is the default value for Cloud customers. - If this setting is not defined, logs are written to
tblActLogtable.
Web request activity information is always written to the configured OIS logging targets, regardless of the EnableActivityLog customer setting.
Only Platform Administrators can change the value of the EnableActivityLog setting.
dbo.tblActLog
The dbo.tblActLog table to which the logs are written includes many different columns, such as:
ID- unique ID is assigned to each new page access.UserId- the IDs for the user and customer accessing the page.CreateTime- the time when the user first accessed the page.PageName- he name of the page that the user accessed, for example,dataobjviewdlg.aspx.PagePath- he complete path to the page, for example,/webservice/oim_systemonboarding.asmx.QueryString- the query string is used to call the page, for example,op=pushconfiguration.EndTime- the time when the user finished accessing the page.IP- the IP address from which the access to the page came.
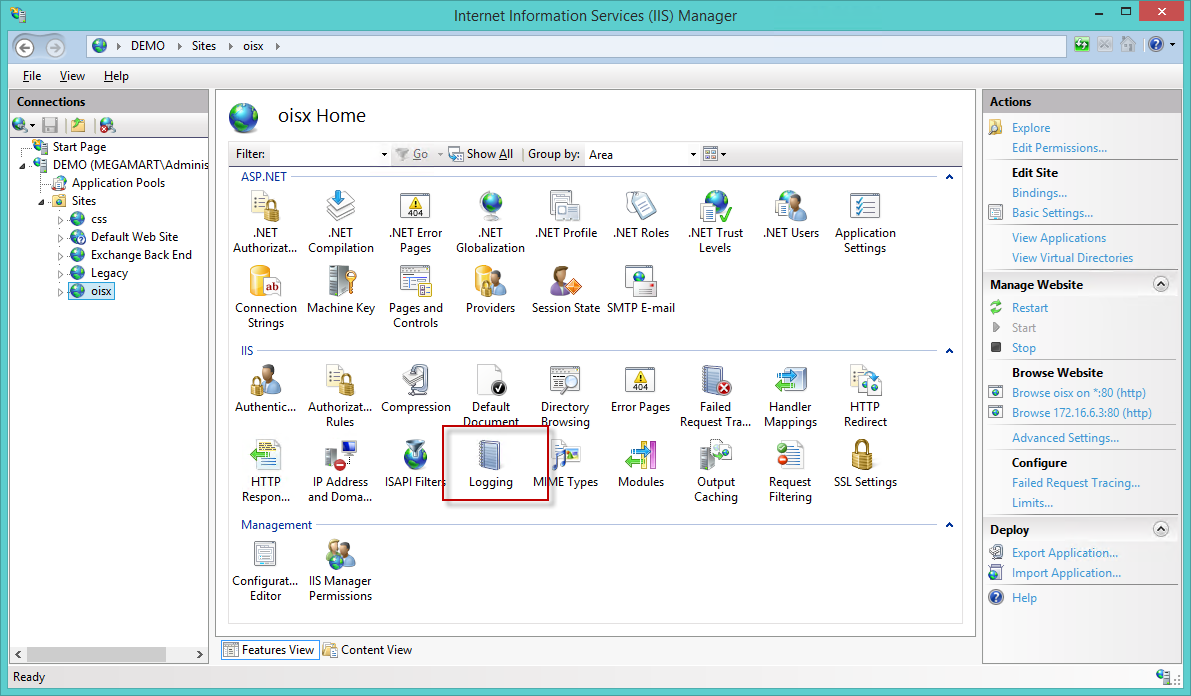
You can extract the data and paste it into a more reading-friendly format, for example, in a Microsoft Excel spreadsheet. You can also use the IIS page log for this type of information. To do this, follow these steps:
-
Open IIS Manager on your computer.
-
Locate the properties for the relevant view.
-
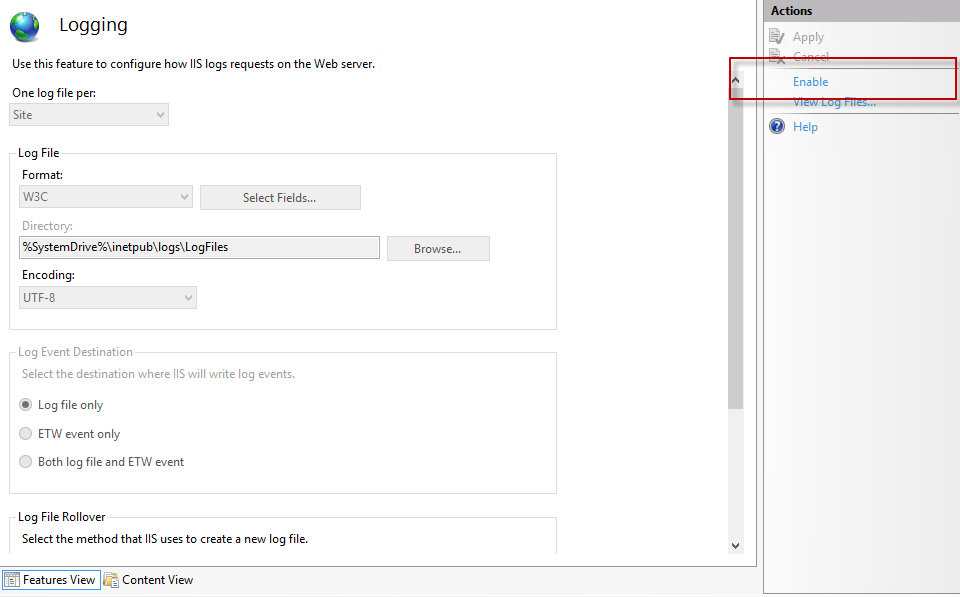
Open the Logging feature.
-
In the Logging feature, select Enable in the Actions pane and specify the format for the log in the Format field.
-
To set up the log schedule, delect from the available log schedules in the Log File Rollover section.
-
To set the location of the log file directory, click Browse in the Log file section and select the specific location of the file. The path is displayed in the Directory field.
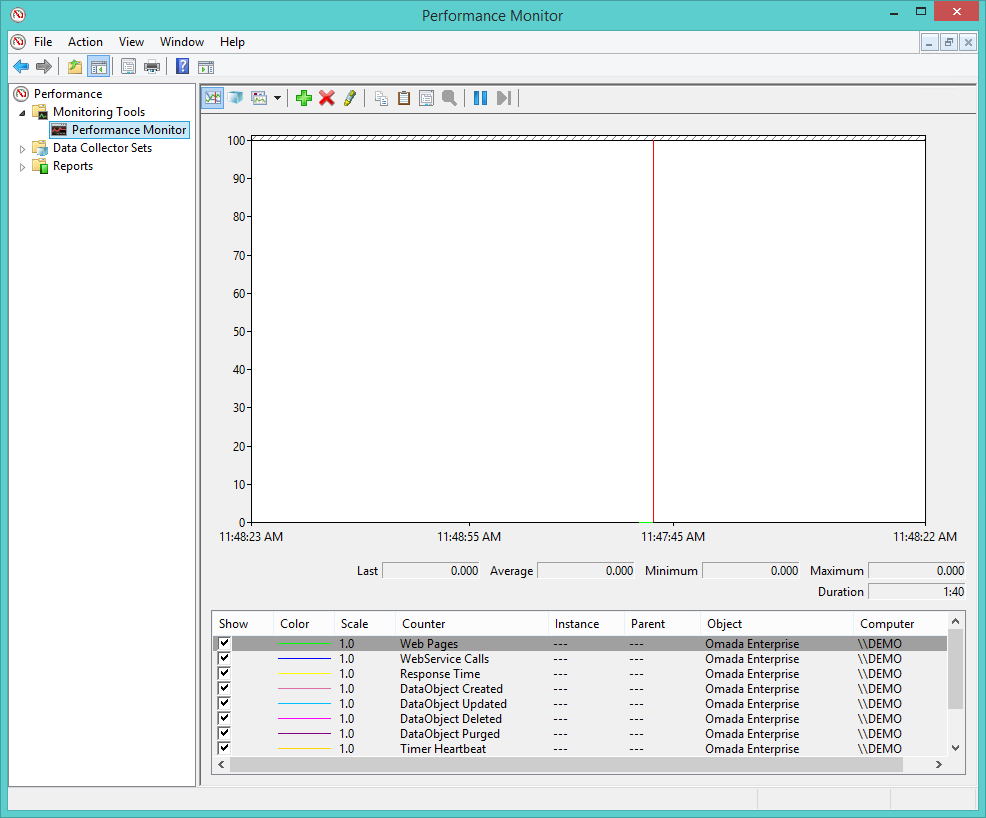
Performance counters
A set of performance counters can support the monitoring of the health of the Omada Identity. Performance counters are a Windows functionality.
They include the following counters:
- Web Pages
- Web Service Calls
- Response Time
- DataObject Created
- DataObject Updated
- DataObject Deleted
- DataObject Purged
- Timer Heartbeat
- RoleEngine Heartbeat
- RoleEngine Identity Calculated
- Session Count
You can find the counters on the application server under the Omada Enterprise category:
Synthetic transactions
There are two functions in the Web Application for synthetic transactions. External monitoring tools can use the transactions to check the availability of the Omada Identity. PingDatabase.aspx is a webpage that shows the message OK when the application is up and running.
The Web Service's end-point is WebService/MasterWebService.asmx. It contains the web service called PingDatabase(), which returns the message OK when the application is up and running.
Code method log
You can use code methods to modify many configurations, for example, data objects, forms, processes, and users. Code methods are included in the basic setup, but users can also create and modify more code methods to suit their particular configuration. Code methods are linked to events, such as creating or modifying objects or the transition of a process.
Whenever someone uses a code method, the use is logged in the Code Method Log. You can find this log in the System Management menu. The code method log can assist you with monitoring the use of code methods and if the code methods are successful.
Find the Code method log view by going to Setup > Logs> Code Method Log. The main view displays a list of code methods that the system has run, as shown in the following image:
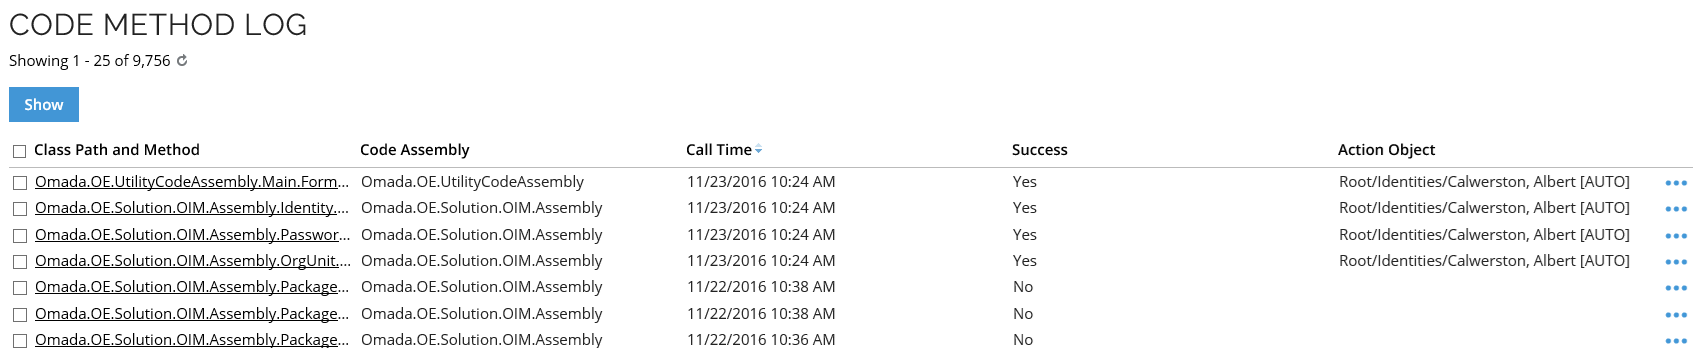
The complete list view includes the following information:
- Class path and method - shows the name of the class path and code method.
- Code assembly - show the code assembly that the code method used.
- Call time - shows the time when the code method was called.
- Success - shows if the code method ran successfully. This can be Yes or No.
- Action object - shows the target of the code method’s action.
When you click a code method in the list, a page opens to display the complete details of the code method that has run.
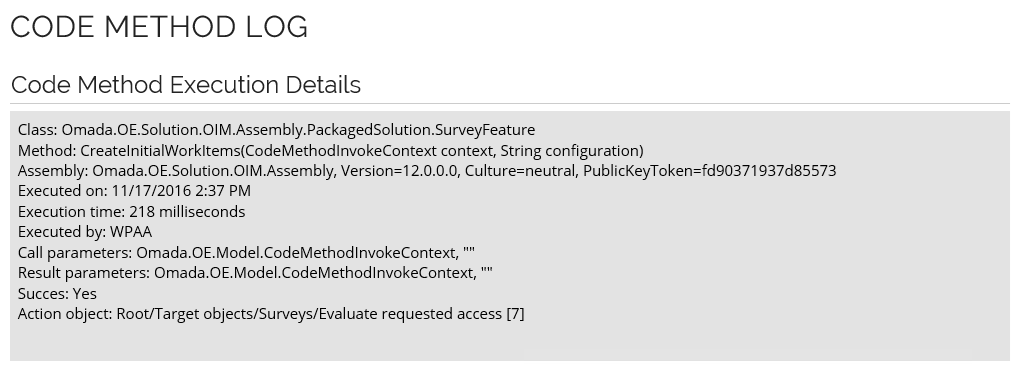
The details on the page include:
- Assembly - shows the code assembly used by the code method.
- Executed on - shows the time and date on which the code method ran.
- Execution time - shows how long time it took to run the code method.
- Executed by - shows the User ID of the user who called the code method.
- Call parameters
- Result parameters
- Success - shows if the code method ran successfully. This can be Yes or No.
- Action object - shows the object on which the code method action took place.
The Code Method Execution Details page can help you troubleshoot a code method if it has not worked successfully. You can also find details about the code methods in the SQL Server database table dbo.tblCodeMethodLog.
Enterprise Server logs
All errors, warnings, and information messages from the Enterprise Server are recorded in the Windows event log on the computer in the Application log. You can access this log from the Event Viewer.
| EventId | Name | Description |
|---|---|---|
| 10000 | Other | Uncategorized error. |
| 10001 | LogError | Error in the log configuration. |
| 10002 | ServerConfiguration | Server configuration error. |
| 10003 | LicenseError | Licensing error. |
| 10100 | ObjectNotFound | Object not found. |
| 10200 | SqlCommon | Uncategorized SQL error. This can be a syntax error. |
| 10201 | SqlTimeOut | SQL error caused by a locked resource or a long-running statement. |
| 10202 | SqlNetworkError | Cannot access the SQL Server. Can be caused by a connection string with errors. |
| 10203 | SqlLoginFailed | Access to the SQL server is denied. The username or password may not be correct. |
| 10204 | SqlTransientError | SQL transient error. |
| 10205 | SqlUniquenessError | SQL uniqueness error. |
| 10206 | SqlRollbackFailure | SQL rollback error. |
| 10300 | CacheLockTimeout | A cache refresh failed because of a locked resource. |
| 10400 | LogonFailure | A user has failed to log in to the application. |
| 10401 | SamlResponseFailed | SAML response failed. |
| 10402 | OpenIDResponseFailed | OpenID response failed. |
| 10403 | UserAuth | Failed to set user password. |
| 10404 | LogonUserIsInactive | User is inactive. |
| 10405 | TooManyLogonAttempts | Too many logon attempts. |
| 10406 | PasswordExpired | Password has expired. |
| 10407 | SamlConfiguration | SAML configuration error. |
| 10408 | LogConfiguration | Log configuration error. |
| 10409 | LogonSuccessful | Logon successful. |
| 10410 | LogoffInitiated | Log off initiated. |
| 10411 | LogInitialized | Log in initialized. |
| 10500 | CodeMethodException | A code method has failed. |
| 10501 | CodeMethodFriendlyException | A code method has thrown a non-fatal exception. |
| 10502 | CodeMethodMalConfiguration | A code method has been configured which contains errors. |
| 10503 | CodeMethodValidation | Code method validation error. |
| 10504 | AccessModifierValidation | Access modifier validation error. |
| 10505 | AccessDataUploadError | Access data upload error. |
| 10506 | ReferencedObjectDeleted | Referenced object deleted. |
| 10550 | XmlSchemaFileUpdateError | Error in the XML schema file updated. |
| 10600 | DatabasePathApplied | A database patch has been installed. |
| 10601 | DatabaseScriptExecute | Database script executed. |
| 10602 | AppStringsImported | App strings imported. |
| 10603 | UpdateActionAssemblyError | Error in the assembly update action. |
| 10604 | UpdateActionExpectedError | Error in the action expected update. |
| 10700 | MailTooManyReceivers | A function was prevented from sending notifications because it would send out too many e-mails, resulting in spam. |
| 10701 | MailNoValidEmailAddress | An e-mail notification could not be sent because no valid e-mail was found. |
| 10702 | MailCannotSendMail | An error occurred while sending an email notification. This may be because of an email relay problem. |
| 10703 | MailCannotBeQueued | Mail cannot be queued. |
| 10704 | MailCannotDecryptVar | Unable to decrypt mail variable. |
| 10705 | MailCannotRemoveMailFromQueue | Cannot remove mail from queue. |
| 10706 | MailCannotAddMailLog | Cannot save mail to log. |
| 10707 | MailSent | Mail sent. |
| 10708 | MailConnection | Mail connection error. |
| 10709 | MailAuthentication | Mail authentication error. |
| 10800 | EventDefTooManyObjects | An event definition did not trigger on all filtered objects because the threshold number of objects was exceeded. |
| 10900 | ILMExportFailed | A MIM export to Enterprise Server failed. |
| 11000 | TraceInformation | Trace information from a code method or another function. |
| 11001 | WebRequest | Web request failed. |
| 12003 | SimulationHubRun | Simulation service failed. |
| 12100 | RunArchiveBatch | Archiving cycle failed. |
| 13000 | WebserviceError | Web service request failed. |
| 13200 | PasswordResetSucceded | Password reset success. |
| 13201 | PasswordResetFailed | Password reset failure. |
| 13202 | PasswordResetOneTimeCode | Password reset one time code. |
| 13203 | PasswordResetBruteForceDetected | Password reset brute force attempt detected. |
| 13204 | PasswordResetMissingDelegateMethod | Password reset missing the delegate method. |
| 13205 | PasswordResetNotificationFailed | Password reset notification not sent. |
| 13206 | PasswordResetVerifyPasswordFailed | Password reset verify password failure. |
| 13207 | PasswordResetAccountLookupFailed | Password reset account lookup failure. |
| 13208 | PasswordResetSystemLookupFailed | Password reset system lookup failure. |
| 13209 | PasswordFilterFailed | Password filter failure. |
| 13210 | PasswordChanged | Password changed. |
| 13211 | PasswordResetClientLoadFailure | Failure to load the password reset client. |
| 13300 | AccessRequestStatusConfigError | Error in the configuration of the access request status. |
| 13350 | PolicyCheckConfigurationError | Error of the policy check configuration. |
| 13351 | PolicyCheckExecutionError | Error of the execution of the policy check. |
| 13400 | ODataError | OData error. |
| 13500 | GraphQLError | GraphQL error. |
| 14000 | AjaxGridError | Ajax grid error. |
| 14001 | AjaxGridPossibleSqlInjectionPrevented | Possible SQL injection in the Ajax grid has been prevented. |
| 15000 | SurveyFeatureInfo | Survey feature information. |
| 15001 | SurveyOwnershipNotAccepted | Ownership of a survey has been rejected. |
| 16000 | ComplexDataSetBuilderError | Error in the complex data set builder. |
| 16001 | CrossDatabaseQueryDetected | Cross database query detected. |
| 17000 | KPIEvaluationError | KPI evaluation error. |
| 18000 | VirtualPropertyResolverError | Virtual property resolver error. |
| 19000 | AssigneeExpressionPathResolutionInfo | Information message about assignee expression path resolution. |
| 19001 | AssigneeExpressionPathResolutionWarning | Warning message about assignee expression path resolution. |
| 20000 | OPEJobNotification | OPE job notification. |
| 21000 | TimeZoneAlignment | Time zone alignment. |
| 21001 | CustomerSettingRangeError | Customer setting range error. |
| 22000 | FIMPasswordReset | FIM password reset. |
| 220001 | ConfigurationChangeImport | Configuration change import. |
| 22100 | UpgradeSyncOfflineSystems | Upgrade sync offline systems. |
| 23001 | SystemEventCat_Employments_IdentityDisabled | Identity has been disabled. |
| 23002 | SystemEventCat_Employments_IdentityLocked | Identity has been locked. |
| 23003 | SystemEventCat_Employments_IdentityReEnabled | Identity has been reenabled. |
| 23101 | SystemEventCat_AccessRequests_RequestSubmitted | Access request submitted. |
| 23102 | SystemEventCat_AccessRequests_RequestApproved | Access request approved. |
| 23103 | SystemEventCat_AccessRequests_RequestRejected | Access request rejected. |
| 23201 | SystemEventCat_Configuration_MembersAdded | Members added. |
| 23202 | SystemEventCat_Configuration_MembersRemoved | Members removed. |
| 23203 | SystemEventCat_Configuration_ResourceChanged | Resource has been changed. |
| 23204 | SystemEventCat_Configuration_ApprovalConfigurationChanged | Approval configuration has been changed. |
| 23205 | SystemEventCat_Configuration_AssignmentPolicyChanged | Assignment policy has been changed. |
| 23206 | SystemEventCat_Configuration_ConstraintChanged | Constraint changed. |
| 23207 | SystemEventCat_Configuration_PrioritizationPolicyChanged | Prioritization policy changed. |
| 23301 | SystemEventCat_Governance_SurveyStarted | Survey started. |
| 23302 | SystemEventCat_Governance_SurveyCompleted | Survey completed. |
| 23303 | SystemEventCat_Governance_SystemOwnersChanged | System owners changed. |
| 23304 | SystemEventCat_Governance_SystemClassificationChanged | System classification changed. |
| 23305 | SystemEventCat_Governance_IdentityCreated | Identity created. |
| 23306 | SystemEventCat_Governance_IdentityModified | Identity modified. |
| 23307 | SystemEventCat_Governance_IdentityManagersChanged | Managers of the identity have been changed. |
| 23308 | SystemEventCat_Governance_OrgUnitManagersChanged | Managers of the organization unit have been changed. |
| 23401 | SystemEventCat_SystemOperation_NewSystemOnboarded | New system onboarded. |
| 23402 | SystemEventCat_SystemOperation_TechnicalIdentityRequested | Technical identity has been requested. |
| 23403 | SystemEventCat_SystemOperation_WarehouseImportSucceeded | Successful Data Warehouse import. |
| 23404 | SystemEventCat_SystemOperation_WarehouseImportPartiallySucceeded | Partially successful Data Warehouse import. |
| 23405 | SystemEventCat_SystemOperation_WarehouseImportFailed | Failure of the Data Warehouse import. |
Email log
The Omada Identity’s system administrator can view a log of all emails that the system has generated.
Omada Identity does not log emails that include sensitive material to the email log, for example, emails that include passwords. Find the log by going to Setup > Administration > System Management > Email Log. The initial view shows an overview of generated emails.
The email log shows:
- The To and From names
- The Subject of the email
- The Date and Time sent.
View the details of a sent email by clicking the Subject in the list view. The details for the email are shown in the Sent Email dialog box.

You can also find details about sent emails in the SQL Server's database table dbo.tblMailLog.
Data Exchange log
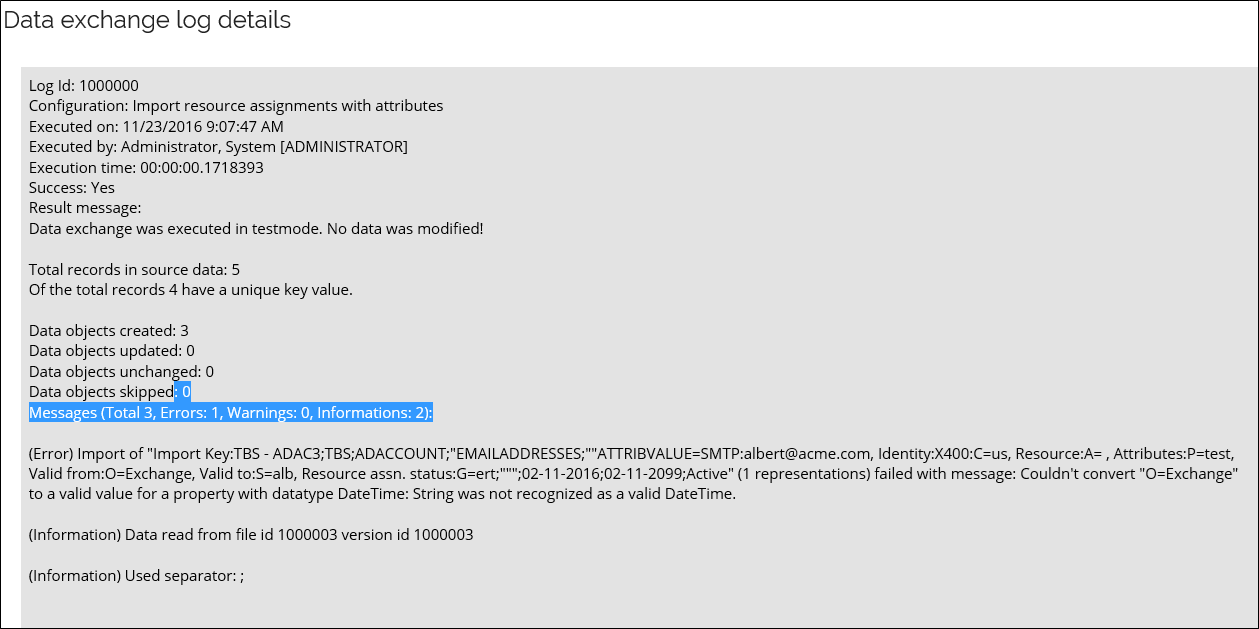
Whenever you have run a data exchange, a log entry of the data exchange is added to the data exchange log. To find the log for data exchange, go to Setup > Administration > Connectivity > Data Exchange.
In the initial view, right-click the data exchange you want to view and select History. The Data Exchange Log dialog box opens and shows all the data exchanges that have taken place on your system.
Click any of the listed data exchanges to see the Data exchange log details for this data exchange. The Data exchange log details include the date and length of the time when the exchange ran, the status of exchange, the number of objects created or updated, and more.
Timer execution log
The timer log list displays a list of all timer runs times. To see this log, go to Setup > Administration > Data management > Timers, click the ellipsis (...) menu for a given timer, and select History. The Timer Execution Log will be displayed.
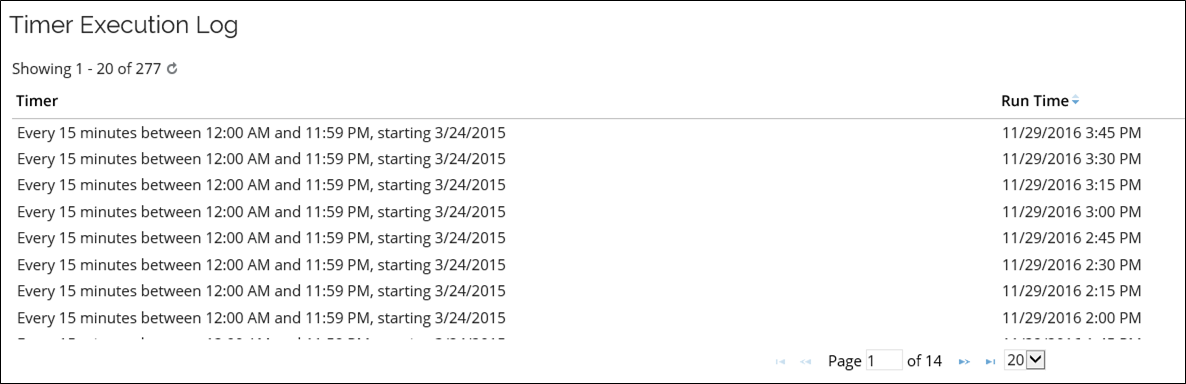
The Timer Execution Log lists the history of whenever a timer ran:
- The name of the timer
- When the timer ran
- The name of the triggering server
You can also find these details in the Enterprise Server's database. The timer log is stored in a table called dbo.tblTimerLog.
Omada Role and Policy Engine log
The Role and Policy Engine creates a log for the Event Viewer with the application name Omada Role and Policy Engine with many events to log.
| ID | Name | Description |
|---|---|---|
| 100 | GeneralInfo | The 100-series are information messages. |
| 101 | CycleRunStarted | RoPE has started a calculation cycle. |
| 102 | CycleRunCompleted | RoPE has completed a calculation cycle. |
| 103 | ManagementAgentInfo | Information from the FIM Management Agent. |
| 104 | RequeuedPreviousFailures | RoPE has automatically queued identities that previously failed calculation again. |
| 105 | QueuedIdentitiesWithRecent ActivationsOrExpirations | The engine has automatically queued identities that either have: An assignment that was pre-valid at the time of calculation, but has meanwhile entered its validity period Or: An assignment that is enabled but with a date in the Valid To setting that is in the past. |
| 106 | DeletedHistoricCalculations | The engine has completed the periodic deletion of historic calculations for all identities |
| 107 | TraceOutput | Info written for problem tracing purposes. |
| 108 | Paused | RoPE paused. |
| 109 | RollbackFailure | Database rollback failure. |
| 200 | GeneralWarning | The 200-series are warning messages. |
| 201 | MasterDataIssue | A non-fatal issue exists in the engine's master data configuration. |
| 300 | GeneralError | The 300-series are error messages. |
| 301 | LockAndLoadQueued IdentitiesError | The entire batch is discarded if one or more identities in it failed to load. |
| 302 | GeneralExecutionError | Error running cycle. |
| 303 | IdentityCalculationError | Error calculating identity. |
| 304 | BatchProcessingError | Error calculating queued identity. |
| 305 | ServiceExecutionError | Error occurred while running cycle. |
| 306 | ODWBusinessKeyResolution Error | Could not resolve an Omada Identity Data Warehouse composed business key to a data object in ES. |
| 307 | ResourcePoolWithMissing ODWBusinessKeyError | One or more systems/resource pools detected that has a system category and thus is expected to be present in the Omada Identity Data Warehouse but does not have a business key in the ES. |
| 308 | SimulationError | Simulation failed. |
| 309 | RemoteAPIAuthentication Failed | Authentication of the RemoteAPI client failed. |
| 900 | Other |
Omada Provisioning Service logs
OPS creates a log for the Event Viewer with the application name Omada Provisioning Service with many events to log.
| EventId | Name | Description |
|---|---|---|
| 101 | FailedToLoadExtension | OPS failed to load extension method. |
| 102 | UnexpectedDatabaseError | Unexpected database error. |
| 103 | EntityValidationErrors | Errors in the entity validation. |
| 130 | UnhandledError | Unhandled error. |
| 151 | FailedParsingConnectionString | Failed parsing of the connection string. |
| 152 | UpgradeFailed | Upgrade failure. |
| 201 | FailedToLoadSystemConfiguration | Failed to load system configuration. |
| 202 | UnexpectedErrorInSystemManager | Unexpected error in system manager. |
| 203 | JobDeemedDuplicate | Duplicate jobs error. |
| 204 | ErrorSavingBatch | OPS batch could not be saved. |
| 205 | FailedToInitializeSystemConfiguration | Failed to initialize the system configuration. |
| 206 | FailedToNotifyQueued | Failed to notify queued. |
| 207 | IntegrityChecker | Integrity checker. |
| 301 | TaskProcessingException | Task processing exception. |
| 302 | TaskProcessingFailed | Task processing failure. |
| 303 | JobProcessingFailed | Job processing failure. |
| 304 | NoConnectorsAvailableInPool | No connectors available in pool. |
| 305 | ErrorDequeuingJob | Dequeuing job error. |
| 401 | StatisticsRefreshed | Statistics have been refreshed. |
| 402 | ThresholdExceeded | Threshold has been exceeded. |
| 403 | NotificationError | Notification error. |
| 501 | NotificationFailed | Notification failed. |
| 502 | NotificationQueue | Notification queue. |
| 601 | ErrorArchivingJobs | Jobs could not be archived. |
| 602 | FailedToInitializeSystemConfiguration | Initialization of the system configuration failed. |
| 603 | UnexpectedErrorInSystemManager | Unexpected error in system manager. |
| 701 | ErrorPurgingJobs | Error purgin jobs. |
| 702 | FailedToInitializeSystemConfiguration | Failed to initiatlize system configuration. |
| 703 | UnexpectedErrorInSystemManager | Unexpected error in system manager. |
| 1001 | DequeueJob | Dequeuing of jobs. |
| 1002 | LoadJobFromStore | Job loaded from store. |
| 1003 | TaskProcessingConnector | Task processing connector. |
| 1004 | ProcessingJob | Job processed. |
| 1005 | PersistBatch | Batch persisting. |
| 1006 | PersistBatchDetails | Batch persisting details. |
| 1007 | PersistBatchDetailsTasks | Batch persisting details tasks. |
System log on-prem
You can use the system log to collect specific data that your organization requires. The system log is stored in a table called dbo.tblSystemLog found in the SQL Server.
For example, you could configure code methods that monitor that a specific process is completed and record the details of when they take place. You can configure your code methods to use the .NET methods that are found in a particular Enterprise Server class to produce logs in a readable format for reports and audits.
The benefits of the system log are flexibility of planning and the ability to create code methods to customize the data to log.
Password reset log on-prem
The Enterprise Server database contains a table tblPasswordResetLog which contains both successful and failed password reset attempts.
The log is only accessible via the SQL Server Management Studio.
The columns are:
| Columns | Description |
|---|---|
| IdentityID_ | The integer ID of the Identity Data Object. |
| IdentityIdent | The username / IDENTITYID. |
| ActionTime | The date and time of the attempt. |
| Action | see values in the table below. |
| Message | Description of the attempt. |
| IP | the IP address of the remote client / caller. |
| Origin | reference the provisioning service OriginId. |
The values of the column Action are:
| Value | Description |
|---|---|
| Enrolled = 0 | User enrolled to password reset. |
| ResetSucceeded = 1 | Reset success. |
| ChallengeResponsFailed = 2 | User failed to answer challenge questions. |
| ResetFailed = 3 | Operation failed. |
| SoftLocked = 4 | Threshold for failed attempts exceeded (temporary lock). |
| HardLocked = 5 | Threshold for failed attempts exceeded (locked). |
| IdentityIdentFailed = 6 | The entered username was not recognized. |
| Submitted = 7 | The password change has been handed over to a provisioning service. |
| Throttling = 8 | Password reset web page is throttling because of many failed requests. |
| Unlocked = 9 | Identity was unlocked by an administrator. |
| PartialSuccess = 10 | The password reset action partially succeeded. |
| ConfigurationError = 11 | Wrong configuration of password reset handlers. |
System statistics
In addition to the various logs that you can view to monitor the system performance, you can use the five statistics reports available in Omada Identity.
To see System statistics, go to in Setup > Administration > More > System Statistics.
The reports are available from the initial System statistics view and are as follows:
- Request count statistics - select a customer (solution) from the drop-down list and the date grouping (year, month, day) to generate a report that lists the number of requests for the solution on a daily, monthly, or yearly basis.
- Avg page processing time - select a customer (solution) from the drop-down list and the date grouping (year, month, day) to generate a report that lists the average processing time in milliseconds of a server request per page on a daily, monthly, or yearly basis.
- Database table rows - this option generates a report that shows the table rows in the database, along with their allocated space; there are no parameters to select.
- Performance statistics - select a customer (solution) from the drop-down list, a date range using the From and To date fields, and a date grouping (year, month, day) for this report. The output shows the number of hits and average processing time for each page on a daily, monthly, or yearly basis. It also compares these values with the values from the previous period and shows the change in percent.
- Code Method statistics - select the grouping (year, month, day) in the drop-down-list to generate a report that lists the code method that was called. The lists include details on ClassPath, method, date, number of calls, the average and maximum processing times.
The system generates the reports as CSV files that you can export and open in a spreadsheet, for example, Microsoft Excel.
ODW export errors
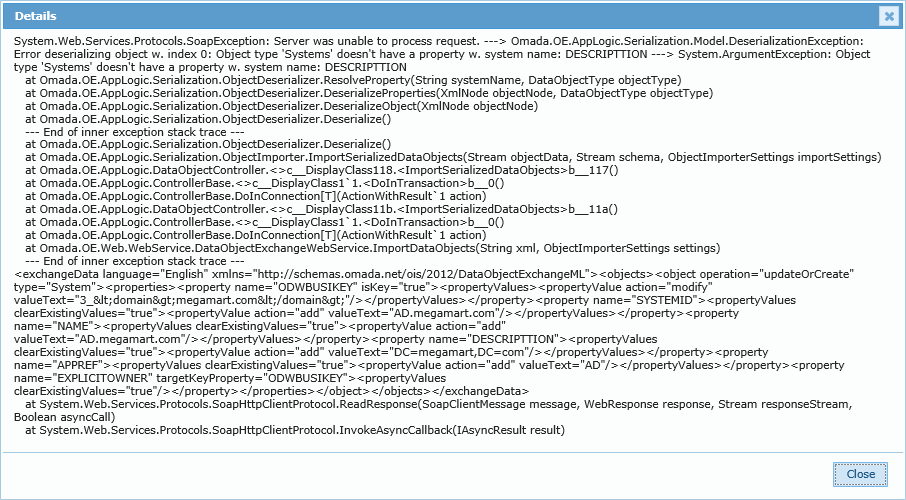
The ODWDashboardExportErrors dashboard widget shows objects that have resulted in export errors in the ODW Export to Enterprise Server. The Retries column shows the number of times the object has been retried.
If you click the link for the ComposedBusinessKey, a detailed error message opens that allows you to investigate the cause of the error.
In the default version of the Operations Dashboard, the ODWDashboardExportErrors widget is included, but you can include it in any custom dashboard by including the following widget definition in a dashboard definition:
{

  name: 'ODWDashboardExportErrors',

  height: 300,

  title: 'ODW Export errors',

  params: {},

  isHiddenEvaluator: function() { return !appPageVars.isODWEnabled; }

}
Import logs on-prem
The history and outcome of imports are logged in several ways. This section describes the locations of these logs and their usage.
SQL Server Agent jobs logs
If you use SQL Server Agent jobs to run imports, the history and outcome of imports are available under Job History in the Log File Viewer. You can right-click the job for which you want to view the history and select View History.
The SQL Server Agent Job can register success even if the containing packages register a failure. This means that you should not use the SQL Server Agent Job as the sole method for verifying that an import has been successful.
Find the SQL Server Agent node at the bottom of the Object Explorer pane in SQL Server Management Studio.
Omada Identity Data Warehouse Sysssislog
All imports are logged to the Omada Identity Data Warehouse’s system table Sysssislog. In addition, it is shown in the execution log for imports in the Omada Identity Portal.
The following events are logged:
- PackageStart
- PackageEnd
- OnPreExecute
- OnPostExecute
- OnWarning
- OnError
- ScriptComponentLogEntry
It is important to note that one error often produces several error rows in the log table, as errors are spread in the internal task hierarchy of the Omada Identity Data Warehouse’s SSIS packages. Along the way, each task independently logs the event until the system reaches a level capable of handling errors.
The table contains everything logged since the database was created. If you want to clean up or empty the tables, you must do this manually. To do this, you can edit the sysssislog using T-SQL, which makes it useful for troubleshooting.
If you run the following query, you can find the latest import:
WHERE source = 'Omada ODW Run' and (event = 'PackageStart') order by starttime desc;
If you want to find any errors in the latest import, you should run the following query, where you write the starttime value below with the value for your latest import:
WHERE starttime > '2016-09-04 13:33' and event like '%error%';
Import log file
You can log the events of an import to a log file by running imports from the command line and specifying a log file name and path.
Example of an import of configuration packages:
DTExec /DTS "\MSDB\Omada\ODW\Omada ODW Run" /SERVER "localhost" /DECRYPT OmadaEncryptionKey /CHECKPOINTING OFF /REPORTING V /SET "\package.variables[ProfileID].Value";"7b7c852d-1896-40d5-b478-992ae014627c" /SET "\package.variables[ProfileType].Value";"config" >"C:\Program Files\Omada Identity Suite\Import Logs\dtlog.txt”
Example of a complete import:
DTExec /DTS "\MSDB\Omada\ODW\Omada ODW Run" /SERVER "localhost" /DECRYPT OmadaEncryptionKey /CHECKPOINTING OFF /REPORTING V /SET "\package.variables[ProfileID].Value";"9b424828-0b8a-4d2b-a4ba-30ca79b0cdcb" >"C:\Program Files\Omada Identity Suite\Import Logs\dtlog.txt”
The command above creates a log file with the filename dtlog.txt in a folder called Import Logs. The log files are overwritten unless you specify a unique name each time you run an import.
Specify /REPORTING V to show a complete status (Verbose) or /REPORTING E to only display errors. If you do not specify a file name, events are logged to the command prompt window.
A verbose log file supplies more information than the Sysssislog table, so the verbose log file may be useful for troubleshooting. If an import fails, you can find the cause of the error by doing a simple search in the log file. Search for errors in the log file using Error: or End Error. By using these two expressions, you exclude information or warning events that simply contain the word error, for example:
Error: 2013-08-21 12:00:14.54
  Code: 0x00000001
  Source: SCR Check License
  Description: License is invalid
End Error
If you run dtexec from anything other than a command line, you cannot see or capture this log output, but the database-based logging described in the next section is always available.
ODW SSIS Job status on-prem
The ODWDashboardStatusDetails widget shows rows (events) from the sysssislog, which is the table that SQL Server Integration Services uses for logging.
It shows data about the latest run of the three jobs Omada ODW Import, Omada ODW OIS Sync, and Omada ODW Export. You can filter the jobs from the dropdown in the Source column.
- If a job has been completed successfully, two rows are shown:
PackageStartandPackageEnd. With these two rows, you can identify when the job was run and for how long it was running. - If a job has resulted in errors, the
OnErrorevent and allPackageStartandPackageEndevents are shown. These events let you identify in which part of the process the error occurred. The error message is shown in theMessagecolumn. - If a job has not been completed within 12 hours, all
PackageStartandPackageEndevents are shown. This allows you to identify what is currently happening.
In the default version of Operations Dashboard, the ODWDashboardStatusDetails widget is included, but you can also include it in any custom dashboard by including the following widget definition in a dashboard definition:
{
  name: 'ODWDashboardStatusDetails',
  height: 300,
  title: 'ODW SSIS job status',
  params: { getStatusDetails: 'Omada ODW Import,Omada ODW OIS Sync,Omada ODW Export' },
  isHiddenEvaluator: function() { return !appPageVars.isODWEnabled; }
}
Monitoring RAM, TEMP directory and tempdb size on-prem
The ODW import requires available temporary storage space, especially on the SSIS Server. You should set the Page File to a certain minimum level, depending on the size of the ODW imports. For large workloads, SSIS writes data to the TEMP directory of the account running the import. It may also write data to the tempdb system database.
For optimal performance, you must make sure of the following things:
- The Page File on the SSIS Server is large or able to grow.
- The TEMP directory of the account running the import is located on a drive with a large amount of free space.
- The tempdb database has room for temporary growth.
To make sure that you have these items configured for optimal performance, it is important to monitor the items, and increase their size when required.
Recommendations on the location of temporary storage
Omada recommends that the temporary storage is not placed on the C: drive.
Dynamic data, including data in the temp folder, should not be located on the system drive but rather on a data drive because:
- You cannot extend the system drive without taking the server down, but you can extend other drives.
- If the system drive is full, the server stops running, but if another drive is full, the server itself can continue to run. Only the processes that use the drive that is full driven are affected.
Performance counters
You can add relevant Omada Identity Data Warehouse counters to the Windows Server Performance Monitor to view the performance of your system.
SSIS Server performance counters
Omada recommends that you add counters for the following items on the SSIS Server to monitor ODW imports.
| Group | Counter |
|---|---|
| SQLServer: SSIS Service 11.0 | SSIS Package Instances |
| SQLServer: SSIS Pipeline 11.0 | * Buffer memory * Buffers in use |
| Process (dtexec) | * Virtual Bytes * Virtual Bytes Peak |
| .NET CLR Memory (dtexec) | * # total committed Bytes * # total reserved Bytes |
| Paging file | * % usage * % usage peak |
| Processor (_Total) | % Processor time |
You can create a custom data collector set in the Performance Monitor to log this information. Schedule the collector set to run during import to allow yourself to view reports on the data collected.
SQL Server performance counters
Omada recommends that you add counters for the following items on the SSIS Server to monitor ODW imports.
| Group | Counter |
|---|---|
| SQLServer:Memory Manager | * Target Server Memory * Total Server Memory |
| Pagine File | * % Usage * % Usage Peak |
| Processor (_Total) | % Processor Time |
You can create a custom data collector set in the Performance Monitor to log this information. You can schedule the collector to run during imports. This allows you to view reports about the data that has been collected.