Key Performance Indicators Data Object Type
The Key performance indicator data object type represents key performance indicators or key figures. The page with a list of available key performance indicators (KPIs) is available from Setup > Administration > More... > Key performance indicators.
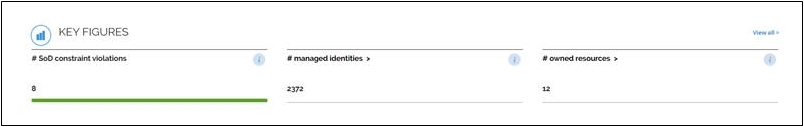
You can display the KPIs in a dashboard by using the KPI widget as shown below:
A KPI is defined in XML. The XML schema is called http://schemas.omada.net/ois/2013/KPIML. You can find it in Setup > Administration > Developer configuration > Xml schemas.
Configuring KPIs
You can use the type attribute to indicate whether the counter should be a scalar data source, a data object counter, or a data object view.
The ID attribute must hold the UID of either a scalar data source, a data object counter or a data object view.
If the counter is a scalar data source, you can use the name attribute instead to indicate the name of a data source.
<?xml version="1.0" encoding="UTF-8"?>

<kpi xmlns="http://schemas.omada.net/ois/2013/KPIML" xmlns:xsi="http://www.w3.org/2001/XMLSchema-instance">

  <counter type="view" id="1138f715-9a56-4a58-8cde-03039fdcc987" image="application_network.png" />

  <thresholds>

  </thresholds>

</kpi>
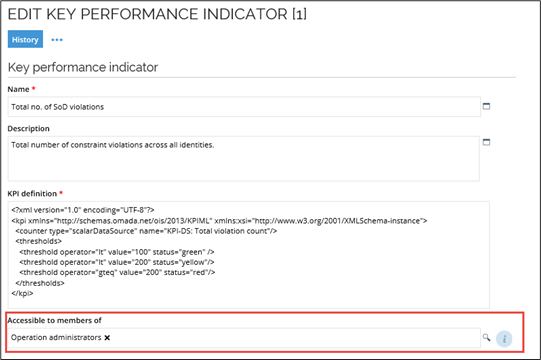
You can specify a number of thresholds which are evaluated in the order that they are listed. It is not a requirement that you set any thresholds defined for a KPI.
<?xml version="1.0" encoding="UTF-8"?>

<kpi xmlns="http://schemas.omada.net/ois/2013/KPIML" xmlns:xsi="http://www.w3.org/2001/XMLSchema-instance">

	<counter type="scalarDataSource" name="KPI-DS: Total violation count"/>

	<thresholds>

		<threshold operator="lt" value="100" status="green" />

		<threshold operator="lt" value="200" status="yellow"/>

		<threshold operator="gteq" value="200" status="red"/>

	</thresholds>

</kpi>
If you do not set any thresholds, the widget will instead display the number in a grey color indication.
Parameters
You can configure the following parameters for the Key Performance Indicator data object:
| Parameter | Description |
|---|---|
| Name | The name of the KPI. This field is mandatory. |
| Description | The description of what a given KPI measures. This field is optional. |
| KPI definition | The mandatory XML schema that defines the KPI. Includes the following attributes: type that indicates whether the data source of the counter is a scalar data source, a data object counter, or a data object view. id that holds the UID of a scalar data source, a data object counter or a data object view. name that can be used for scalar data sources instead of the id. drillDownType that defines what type of popup will open for a drilldown. This attribute is optional. Two values are possible: drillDownType="dataSource"drillDownType="ropeIdentities"**drillDownParams**="” that can specify parameters for the ropeIdentities widget or the name of a drill-down data source. This attribute is optional.Example for ropeIdentities: drillDownParams="{ 'requireFailure': true, 'cols': ['lastStatus', 'lastProcessedTime', 'calculationTime', 'log'] }"thresholds where you can specify a number of thresholds to be evaluated, for which the “green”, “yellow” or “red” status will be displayed in the appropriate dashboard. |
| Accessible to members of | This setting allows you to configure the KPI to be displayed only to certain user groups in the key figures’ widget on the default dashboard. |
Drill-down configuration
On the KPI Tiles widget, user can click the name of the KPI to drill-down the underlying data set.
If the KPI is based on a view counter, then the view details are presented, for example:
<counter type="view" id="3f1360b7-da26-45f4-9a90-a28ab8ededa8"/>
You can set also set the KPI to show the OPS monitor. Add the following attribute to the counter element in the KPI xml definition:
“detailsClick = "omada.opsmonitor.showWidgetAsPopup()"”
If the KPI has the detailsClick attribute defined, an inline javaScript code will be executed when clicked. The code can invoke a built-in function to open a popup with relevant data, for example:
<counter type="scalarDataSource" name="KPI-DS: Provisioning Service Status" hideCount="true" detailsClick = "omada.opsmonitor.showWidgetAsPopup()" />
If the KPI has drillDownType attribute with the value dataSource defined, a popup will open, presenting the data source defined inside the drillDownParams attribute, for example:
<counter type="scalarDataSource" name="KPI-DS-DAX: # non-certified assignments" drillDownType="dataSource" drillDownParams="KPI-DD-DAX: #orphan accounts" />
If the KPI has the drillDownType attribute with the value ropeIdentities defined, a popup will open, presenting RoPE identities calculation results.
The following parameters can be defined inside the drillDownParams attribute:
maxMins- the maximum calculation age in minutes.requireFailure- only display the calculations in the Failure status.requireWarning- only display the calculations in the Warning status.onlyPending- only display the identities with pending calculations.violationStatus- he statuses are "allowed", "pending" or "any" – display the calculations with the allowed, pending or any violation status.cols- columns to be presented in the opened popup.
Example definition:
<counter

  type="scalarDataSource"

  name="KPI-DS: Identities w. calculation error"

  drillDownType="ropeIdentities"

  drillDownParams="{ 'requireFailure': true, 'cols': ['lastStatus', 'lastProcessedTime', 'calculationTime', 'log'] }"

/>
KPI visibility in the user interface
You can configure KPIs to only be displayed to certain users. You can configure the Accessible to members of setting for each type of KPI to select one or more user groups. The setting allows you to only show KPIs for certain users in the key figures' widget on the default dashboard.
Links to additional information
KPIs of the type dataObjectView automatically have a link that displays counted data objects.
If the KPI is based on a scalar data source, you can specify a custom JavaScript function to a popup, for example:
<?xml version="1.0" encoding="UTF-8"?>

<kpi xmlns="http://schemas.omada.net/ois/2013/KPIML" xmlns:xsi="http://www.w3.org/2001/XMLSchema-instance">

  <counter type="scalarDataSource" name="KPI-DS: Identities w. calculation warnings" image="user2_warning.png"
    detailsClick="omada.dialogHelper.showDashboardWidgetDialog({ widget: 'RoPEIdentities', title: $kpi_name$, height: 480, width: 640, params: { requireWarning: true, cols: ['lastStatus', 'lastProcessedTime', 'calculationTime', 'log'] } });" />

  <thresholds>

  </thresholds>

</kpi>
Control access to KPIs
The Key Performance Indicators (KPIs) that are available to a user is controlled by the property "Accessible to members of" on the KPI object. The property refers to the User groups whose members have access to the KPI. If you want to hide a KPI from a user group, you can remove the user group from the property. You can leave the field blank to not display the KPI to any users.
The data that is displayed in the KPI is based on a counter that is either a Data Object view or Data Source data object. If you want to give access to additional user groups, you must ensure that the users are added to the access logic for the counter. For a View you may need to adapt the filters and/or access modifier. For a Data source counter you may need to change the auth roles that can execute the query, and/or the query logic.