Reports
Omada Identity Data Warehouse (ODW) is a dedicated identity management data warehouse. It is designed for use as a data source for compliance applications.
Report overview
The Warehouse uses Microsoft SQL Server Reporting Services (SSRS) for reporting purposes. SSRS is a server-based reporting platform that provides extensive reporting functionality. It runs on Microsoft’s business intelligence platform.
The Data Warehouse offers historical reporting abilities. A point-in-time (or snapshot) report shows current data or data for a specific date in the past. You can also specify the “from” and “to” dates to view a slice of historical data. A log report shows when changes were last made to data within a specified time period.
The ODW Reports can be set up in SSRS in Native mode or SharePoint Integrated mode (for display in SharePoint).
Reporting language
ODW reports have the following standard languages: English, German, Danish, Swedish, Dutch, French and Norwegian. The language displayed is based on the language you selected in My Settings. English is the default language and will be used if the language preferences have been set to any language other than the ones mentioned above. It is possible to add additional languages and change the default language.
Report access
Omada recommends that ODW reports are accessed from the Enterprise Server.
System administrators can also access the reports using the native SSRS Report Viewer.
Data security
ODW report data security is based on roles and ownership. The Data Warehouse contains an Auditor role and a Reader role. The Auditor role has read access to all data. The Reader role has read access to a subset of data, based on ownership. A system owner has read access to the systems he owns, but not to any other system. Similar for, identity owners and context owners.
When users connect to the Data Warehouse through a report or any other client, they log on with their Active Directory account. If the account possesses neither the Auditor nor Reader role, the user cannot see any data. If the account possesses the Auditor role, the user can see all data. If the account possesses the Reader role, the user’s ownership decides what data the user can see.
In order to determine the user’s ownership, the user must be identified. In the Omada Identity Data Warehouse, the user is the identity that owns the account that is logged on. The user’s ownership is determined as all the systems, resources, identities and contexts that the identity owns.
Report navigation
Here, you can find information on the general navigation concepts of the reports.
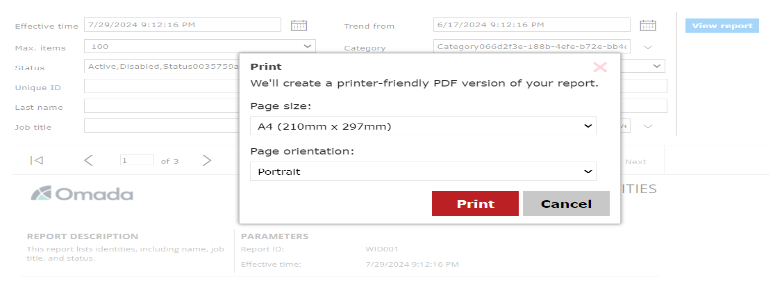
If you want to create a PDF version of the report, click the Print icon and select the relevant page size and orientation settings to ensure your report is formatted correctly for printing.
Report parameters
In the report parameters, you can view and change the parameters that apply to the report shown. Changing some parameters (for example, date/time) requires clicking the View Report button again to reload the report.
Free text parameters can be used to search in the corresponding field in the database. The search supports wildcards. Use “_ as a single character wildcard, and “% as a multiple character wildcard.

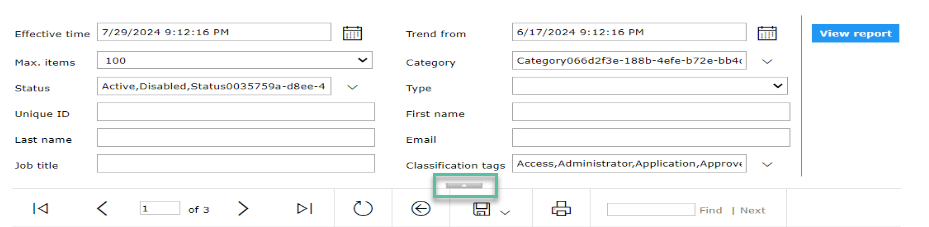
If the report parameters are not expanded, click the down arrow located above the navigation pane to expand the list and see all the available parameters.
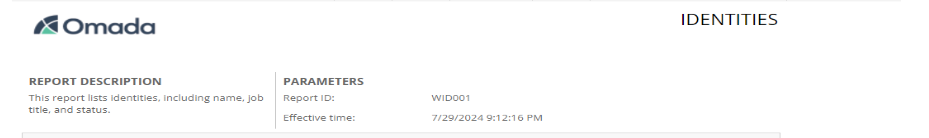
Report details
The report details section contains two or three sections: Report description, Parameters and in some cases Related reports. Report description shows the description of the report. Parameters shows pertinent parameters applied to the report. Related reports contain links to relevant reports.
The dashboard reports do not have a report details section.
Report content
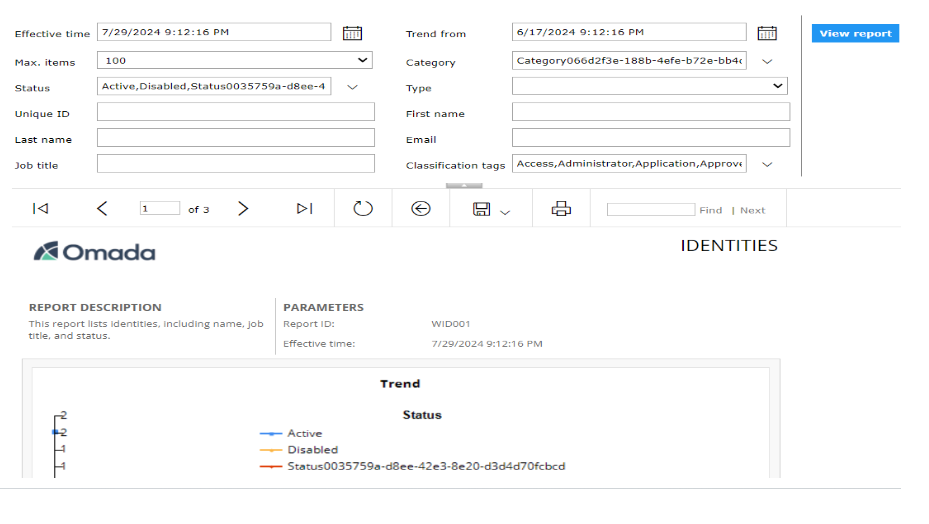
The content section of the report shows the dynamic content of a report. There are five types of content: trend graph, trend matrix, list, details, and change log. A report often contains more than one type of content. The System details report (shown below) contains a trend graph and trend matrix as well as a details section.
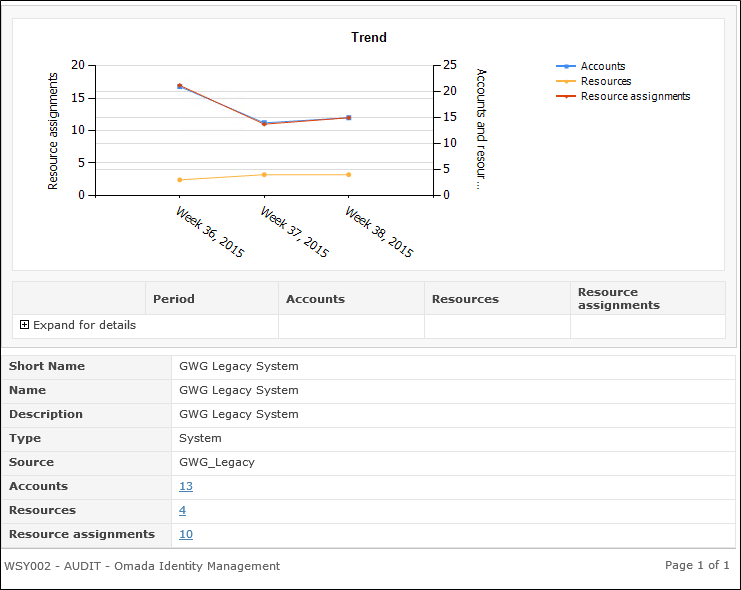
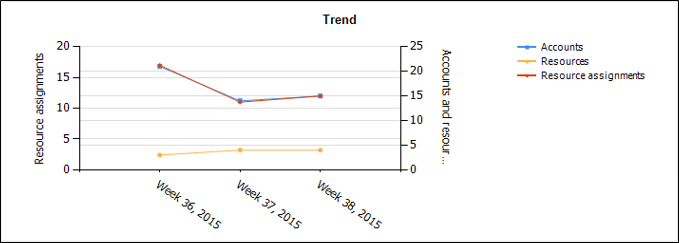
Trend graph
A trend graph shows changes over time in a graph. The period is dependent on the parameters set for the report. If the report parameters contain a Trend from parameter, this parameter controls the from date, and effective time the to date. The legend on the right-hand side explains what the lines show.
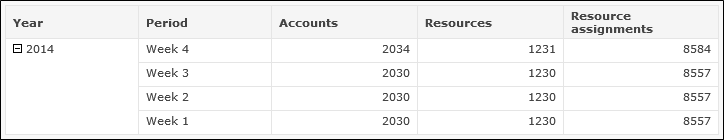
Trend matrix
A trend matrix allows you to drill down to see changes per period. The period measurement is dependent on the parameters set for the report. If the report parameters contain a Trend from parameter, it controls the from date, and effective time the to date.
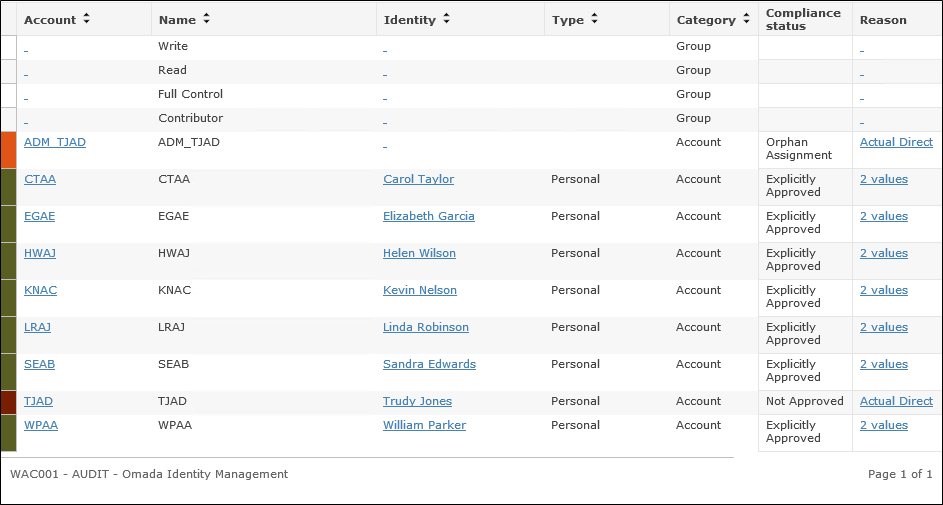
List
List content will list each object within the report scope, in a separate line. You can sort the report by clicking the list header you wish to sort on. The example below is a list of accounts.
Details
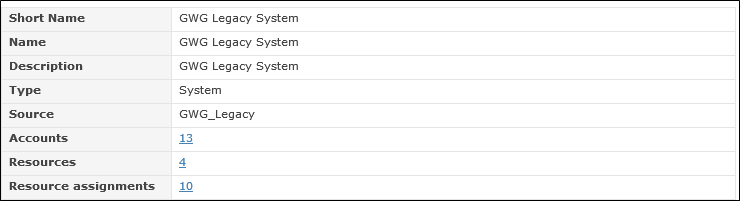
Detail content shows details for an object. The example below is of the details section in a System details report.
Change log
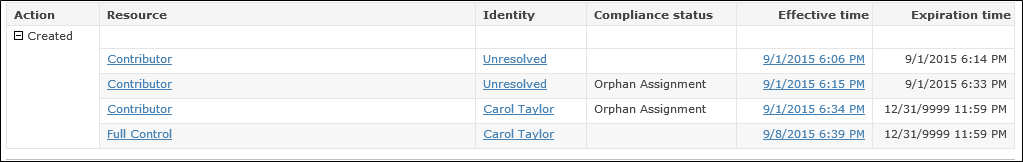
Change logs allows you to see changes that happened at particular time. Click the expand icon (plus sign) to expand the object. Only changes within the selected to and from dates are listed.
Report footer
The report footer will show the Report ID, the Actor Role of the user viewing the report, the application, and the current and total number of pages.

For printed reports (including PDF) the report footer will also show execution time, the user who printed the report and the time the report was printed.

Available reports
The following graphics shows the relations between the available reports:
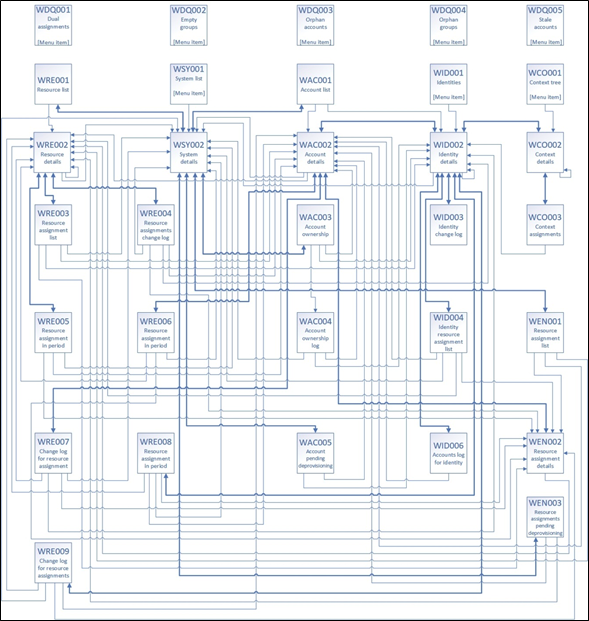
Click on each report to find the relevant information:
📄️ Account reports
Overview of account reports
📄️ Context reports
Overview of context reports
📄️ Identity reports
Overview of identity reports
📄️ Resource reports
Overview of resource reports
📄️ Resource assignment reports
Overview of resource assignment reports
📄️ System reports
Overview of system reports
📄️ Audit trail reports
Overview of audit trail reports
📄️ Constraint reports
Overview of constraint reports
🗃️ Audit reports
2 items
📄️ Operation reports
Overview of operation reports
📄️ ODW Reports
Overview of ODW Reports
📄️ My reports
Reports in this section show the same types of data as the Context, Systems, and Data quality reports, however, the data is filtered for the specific user.
📄️ Report security
In this section, you can find a step-by-step process describing how to configure the report security in distributed environment. The process in this guide is applicable to this environment setup:
📄️ Known limitations
The legacy Calculated Assignment reports, accessible only through the URL OIM_CalcRoleAssignmentCrit.aspx (these reports are no longer available via Omada Identity menus), have a limit to the number of elements one can pick in the Criteria screen. If the size of the URL to the report screen exceeds 2KB, the report will not be rendered.